Tag Archives: Technical analysis

Stock Market Basics: How to Start Trading Shares Safely and Smartly

Getting Started with Stock Trading: What Every Beginner Should Know

Trading stocks is one of the most popular ways to build wealth over time. Whether you’re interested in long-term investing or short-term trading, understanding the core principles of how the stock market works is the first step toward making informed decisions and reducing unnecessary risks.

1. What Is Stock Trading?

Stock trading involves buying and selling shares of publicly listed companies on stock exchanges like the New York Stock Exchange (NYSE), NASDAQ, or the London Stock Exchange (LSE). When you buy a stock, you’re purchasing a small piece of ownership in a company. The goal is typically to buy low and sell high—profiting from the increase in share price over time.

2. Types of Stock Traders

There are different trading styles depending on your goals and risk tolerance:

  • Day traders: Open and close trades within the same day, focusing on small, frequent profits.
  • Swing traders: Hold positions for days or weeks to benefit from short-term trends.
  • Position traders: Hold stocks for weeks to months, often based on market cycles.
  • Investors: Buy and hold shares for years, focusing on long-term growth and dividends.

3. Choosing a Brokerage Platform

To trade stocks, you’ll need to open an account with a brokerage firm. Look for platforms that offer:

  • User-friendly interfaces (especially for beginners)
  • Low or zero commissions on trades
  • Strong research tools and educational content
  • Mobile and desktop trading access

4. Understanding Stock Categories

Not all stocks are created equal. Common categories include:

  • Blue-chip stocks: Large, stable companies like Apple, Microsoft, and Coca-Cola.
  • Growth stocks: Companies expected to grow faster than average, such as tech startups.
  • Dividend stocks: Pay regular income to shareholders, ideal for long-term investors.
  • Penny stocks: Low-priced, high-risk shares often with limited liquidity.

5. How to Analyze a Stock

Before buying any stock, you should perform both fundamental and technical analysis:

  • Fundamental analysis: Examines a company’s earnings, financial health, leadership, and industry outlook.
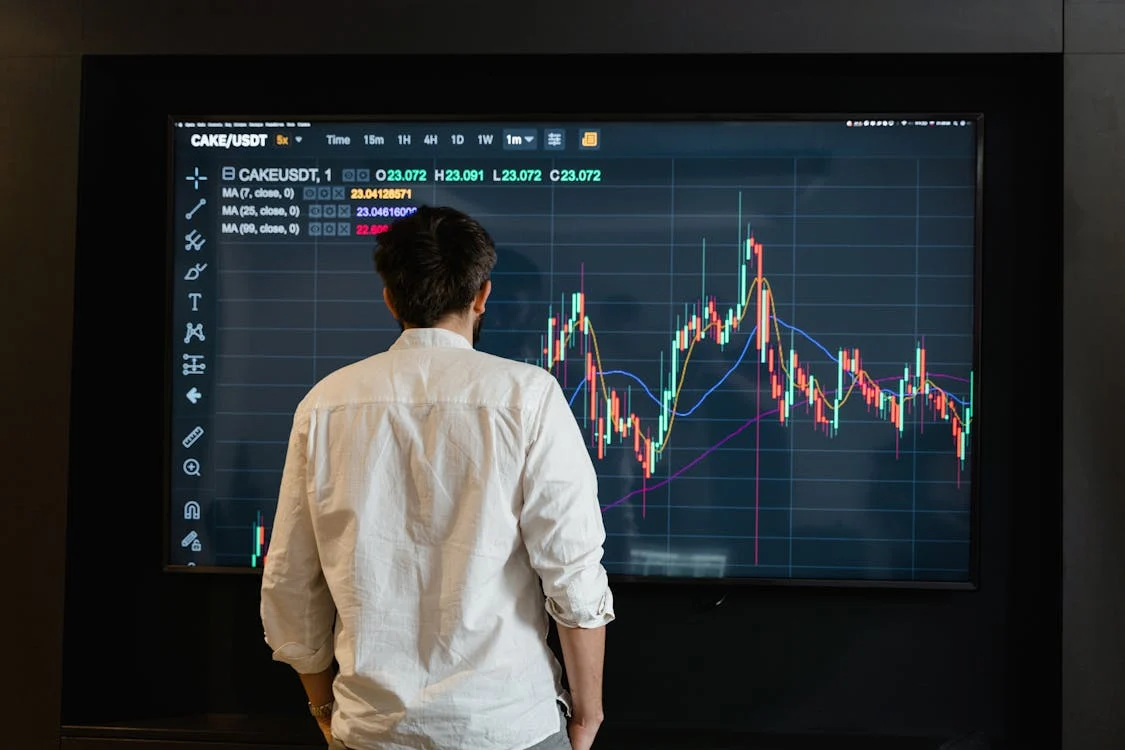
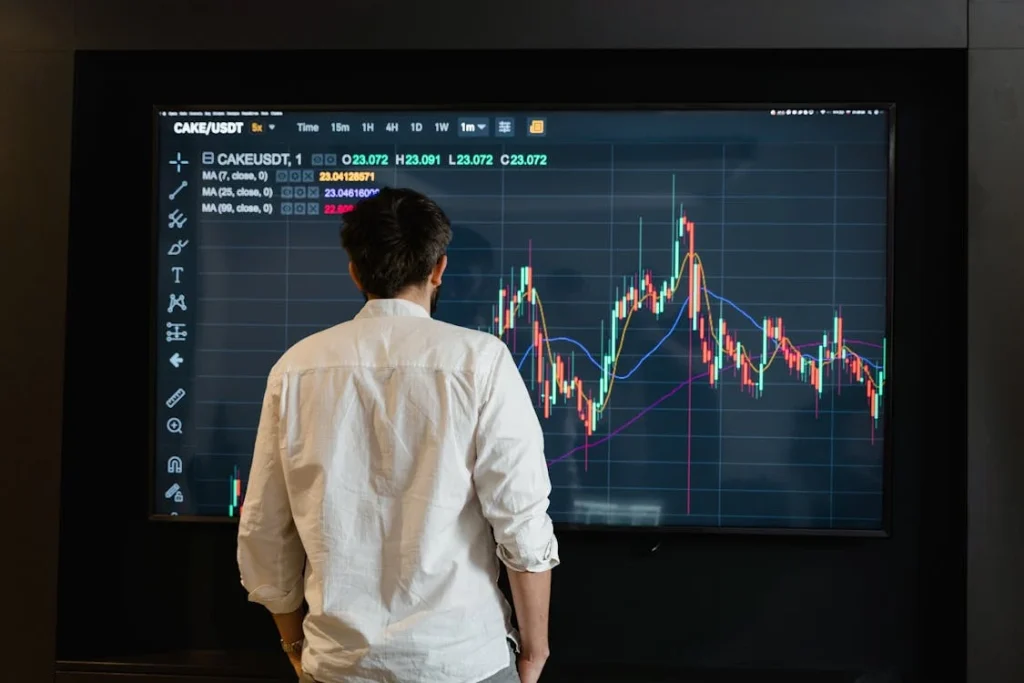
  • Technical analysis: Focuses on price charts, patterns, volume, and indicators like RSI or moving averages to forecast price movement.

6. Economic Events That Influence Stock Prices

Stock markets are affected by broader economic conditions and news, such as:

  • Interest rate decisions by central banks
  • Inflation reports and GDP growth
  • Corporate earnings announcements
  • Geopolitical tensions or unexpected events

7. Risk Management Tips for Stock Traders

  • Diversify your portfolio across different sectors and industries.
  • Use stop-loss orders to automatically exit losing trades.
  • Don’t invest money you can’t afford to lose.
  • Keep emotions in check—avoid panic selling or buying into hype.
  • Stick to a trading plan and review your results regularly.
How Professional Traders Develop Their Strategies in the Forex Market

The Forex market, also known as the foreign exchange market, is one of the largest and most liquid financial markets in the world. With daily trading volume exceeding $6 trillion, it offers opportunities for traders to profit by buying and selling different currencies. However, succeeding in the Forex market requires more than just luck; it demands careful planning, strategy development, and risk management. In this article, we will explore how professional traders develop their strategies to make informed decisions and increase their chances of success.

Understanding the Forex Market

Before diving into trading strategies, it’s crucial to understand how the Forex market operates. Forex trading involves exchanging one currency for another with the aim of making a profit from fluctuations in exchange rates. The market operates 24 hours a day, five days a week, allowing traders to take advantage of opportunities at any time.

1. The Role of Analysis in Forex Trading

Professional Forex traders rely on two main types of analysis to guide their trading decisions:

Technical Analysis

This method involves studying price charts and using indicators, such as moving averages, RSI (Relative Strength Index), and MACD (Moving Average Convergence Divergence). Technical analysis helps traders identify trends and predict future price movements.

Fundamental Analysis

This approach focuses on economic indicators and global events that influence currency prices, such as interest rates, inflation, political stability, and GDP growth. Fundamental analysis provides a broader view of the factors driving the market.

Both types of analysis are essential for developing a robust trading strategy, and many professional traders use a combination of both to make informed decisions.

2. Risk Management and Position Sizing

One of the most crucial aspects of successful Forex trading is risk management. Professional traders understand that the Forex market can be highly volatile, and losing trades are inevitable. Therefore, they focus on controlling risk by using techniques like:

Stop-Loss Orders

These are used to limit potential losses by automatically closing a trade once it reaches a certain price level.

Position Sizing

Traders determine the appropriate amount of capital to risk on each trade. A common rule of thumb is to risk no more than 1-2% of your trading capital on any single trade.

Risk-Reward Ratio

This is the ratio between the potential profit and the potential loss of a trade. A common target is a 2:1 risk-reward ratio, meaning the trader aims to gain twice as much as the amount they are risking.

3. Developing a Trading Plan

Every successful trader operates with a detailed trading plan. A trading plan outlines the trader’s goals, risk tolerance, and specific rules for entering and exiting trades. It also includes the trader’s preferred analysis methods and strategies. A well-crafted trading plan helps traders stay disciplined and avoid emotional decisions that could lead to significant losses.

4. Practicing Patience and Discipline

One of the biggest challenges in Forex trading is maintaining patience and discipline. Professional traders understand that not every trade will be profitable and that the key to long-term success lies in consistency. They avoid chasing quick profits and instead focus on steady, sustainable growth.

5. Continuous Learning and Improvement

The Forex market is constantly evolving, so it is essential for traders to stay informed about market trends, new strategies, and technological advancements. Professional traders continually educate themselves through books, courses, webinars, and other resources to improve their skills and adapt to changing market conditions.

Technical Analysis in the Forex Market: A Beginner’s Guide

Technical analysis is one of the most popular methods used by Forex traders to predict price movements and make informed trading decisions. Unlike fundamental analysis, which looks at the economic factors influencing currency prices, technical analysis focuses on historical price data and chart patterns to forecast future trends. In this article, we will explore the basics of technical analysis and how it can be applied in Forex trading.

What is Technical Analysis?

Technical analysis involves analyzing price charts, market data, and indicators to identify trends and patterns that can predict future price movements. The idea behind technical analysis is that price movements are not random, and they follow predictable patterns over time due to the behavior of market participants.

The primary tools used in technical analysis are charts, indicators, and oscillators. Traders use these tools to look for patterns, trends, and signals that can guide their trading decisions.

Key Components of Technical Analysis

1. Price Charts

The foundation of technical analysis is the price chart. Price charts display the historical movement of a currency pair over a specific period. The three most common types of charts used in technical analysis are:

  • Line Chart: The simplest form of a chart, showing a line that connects the closing prices of a currency pair over time.

  • Bar Chart: A more detailed chart showing the opening, closing, high, and low prices for each time period.

  • Candlestick Chart: A popular chart type that provides more information than bar charts. Each candlestick represents a specific time period and shows the open, close, high, and low prices. Candlestick charts are favored for their ability to display price action clearly.

2. Trendlines and Support/Resistance Levels

One of the first steps in technical analysis is identifying trends. Trends refer to the general direction of the market: up, down, or sideways. Traders use trendlines to mark the direction of the trend and determine entry and exit points.

  • Support levels are price points where a currency pair tends to stop falling and may start rising again. Support acts like a floor for prices.

  • Resistance levels are price points where a currency pair tends to stop rising and may reverse direction. Resistance acts like a ceiling for prices.

3. Moving Averages

A moving average is a technical indicator that smooths out price data by creating a constantly updated average price. The two most common types of moving averages are:

  • Simple Moving Average (SMA): The average of prices over a specific number of periods.

  • Exponential Moving Average (EMA): Gives more weight to recent prices, making it more responsive to recent price movements.

Moving averages help traders identify the overall direction of a trend and can act as support or resistance levels.

4. Oscillators and Indicators

Oscillators are tools used to identify overbought or oversold conditions in the market. The most common oscillators used in Forex trading are:

  • Relative Strength Index (RSI): A momentum oscillator that measures the speed and change of price movements. It ranges from 0 to 100, with readings above 70 indicating overbought conditions and readings below 30 indicating oversold conditions.

  • Moving Average Convergence Divergence (MACD): A trend-following momentum indicator that shows the relationship between two moving averages of a currency’s price. It is used to identify changes in the strength, direction, and duration of a trend.

Other important indicators include the Bollinger Bands, Stochastic Oscillator, and Fibonacci retracement levels.

How to Use Technical Analysis in Forex Trading

1. Identifying Trends

The first step in using technical analysis is identifying the market trend. If the market is trending upward, it is a bullish trend, and if it is moving downward, it is a bearish trend. A sideways market indicates a lack of trend or range-bound market.

Traders should use tools like trendlines and moving averages to help identify the trend and trade in the direction of that trend.

2. Recognizing Chart Patterns

Chart patterns are formations created by the price movements of a currency pair. Some of the most common chart patterns are:

  • Head and Shoulders: A reversal pattern that signals the end of an uptrend and the beginning of a downtrend.

  • Double Top/Double Bottom: Reversal patterns indicating a price level that will likely not be surpassed.

  • Triangles: Continuation patterns that indicate the price is likely to continue moving in the same direction after a period of consolidation.

Recognizing these patterns early can help traders make informed decisions about when to enter or exit a trade.

3. Using Indicators for Confirmation

Indicators can help traders confirm their trade signals and enhance their analysis. For example, if a bullish candlestick pattern forms at a support level, traders may use the RSI to confirm that the currency is not yet overbought. Similarly, a MACD crossover can confirm the strength of a trend.

4. Setting Stop-Loss and Take-Profit Orders

One of the key aspects of risk management is the use of stop-loss orders to limit potential losses. A take-profit order is used to lock in profits at a predefined price level.

Traders use support and resistance levels to set their stop-loss and take-profit orders. For example, if entering a long position at support, a trader may place a stop-loss just below the support level to limit risk.

Advantages of Technical Analysis in Forex Trading

  • Visual Tools: Price charts and indicators make it easier for traders to spot trends and patterns.

  • Objective Decision-Making: By relying on historical price data and indicators, traders can make decisions based on facts rather than emotions.

  • Versatility: Technical analysis can be applied to any currency pair and works on different timeframes, from short-term scalping to long-term trading.

Exploring the Forex Market: A Complete Guide to Currency Trading

The Forex market is one of the largest and most liquid financial markets in the world. It involves the exchange of currencies from around the globe, offering opportunities for traders to profit from the fluctuating values of these currencies. Every day, millions of dollars are traded, making Forex a key part of the global economy.

What is Forex Trading?

Forex trading, also known as foreign exchange trading, involves the buying and selling of currencies in pairs, such as EUR/USD (Euro/US Dollar) or GBP/JPY (British Pound/Japanese Yen). The goal is to predict whether one currency will rise or fall in value against another. This dynamic and fast-paced market operates 24 hours a day, five days a week, and is highly accessible to traders worldwide.

Why Choose Forex Trading?

Liquidity and Accessibility

One of the biggest advantages of Forex trading is its high liquidity, which means traders can buy and sell currencies easily without worrying about price manipulation. Additionally, the market is accessible to anyone with an internet connection, making it possible for retail traders to participate without significant barriers to entry.

Leverage Opportunities

In Forex trading, brokers offer leverage, which allows traders to control larger positions with a relatively small amount of capital. This can amplify profits, but it’s essential to use leverage wisely, as it can also magnify losses.

Diverse Currency Pairs

Forex trading offers a wide range of currency pairs, including major, minor, and exotic pairs. This diversity allows traders to explore various markets and find opportunities based on different economic conditions and geopolitical events.

Key Elements for Successful Forex Trading

Education and Knowledge

Before diving into Forex trading, it’s important to learn the basics. Traders should understand technical analysis, which involves studying charts and patterns, and fundamental analysis, which focuses on economic data and news events that can impact currency values.

Risk Management

Effective risk management strategies are crucial in Forex trading. Traders should always use stop-loss orders to limit potential losses and never risk more than a small percentage of their trading account on a single trade. The key to long-term success is protecting your capital while maximizing your profits.

Discipline and Patience

Trading Forex requires a high level of discipline and patience. It’s easy to get caught up in the excitement of the market, but the most successful traders are those who stick to their strategies and avoid emotional decision-making. Developing a consistent trading routine and sticking to it can help traders stay focused and increase their chances of success.

Challenges in Forex Trading

While Forex trading offers great opportunities, it also comes with its own set of challenges. The market is highly volatile, and currency prices can change rapidly due to global economic events or geopolitical news. Additionally, emotional trading can lead to poor decisions, and over-leveraging can increase the risk of substantial losses.

To be successful, traders need to stay informed, manage their risks, and develop a solid trading plan that suits their individual goals and risk tolerance.