Tag Archives: Support and resistance Forex

The Role of Technical Analysis in Forex Trading: A Comprehensive Guide

Mastering Forex Market Trends with Technical Analysis

Technical analysis is one of the most essential tools for Forex traders looking to make informed decisions in the market. It involves the study of past market data, primarily price and volume, to forecast future market movements. This guide will explore the role of technical analysis in Forex trading, providing insights into key concepts, tools, and strategies that traders use to gain an edge in the market.
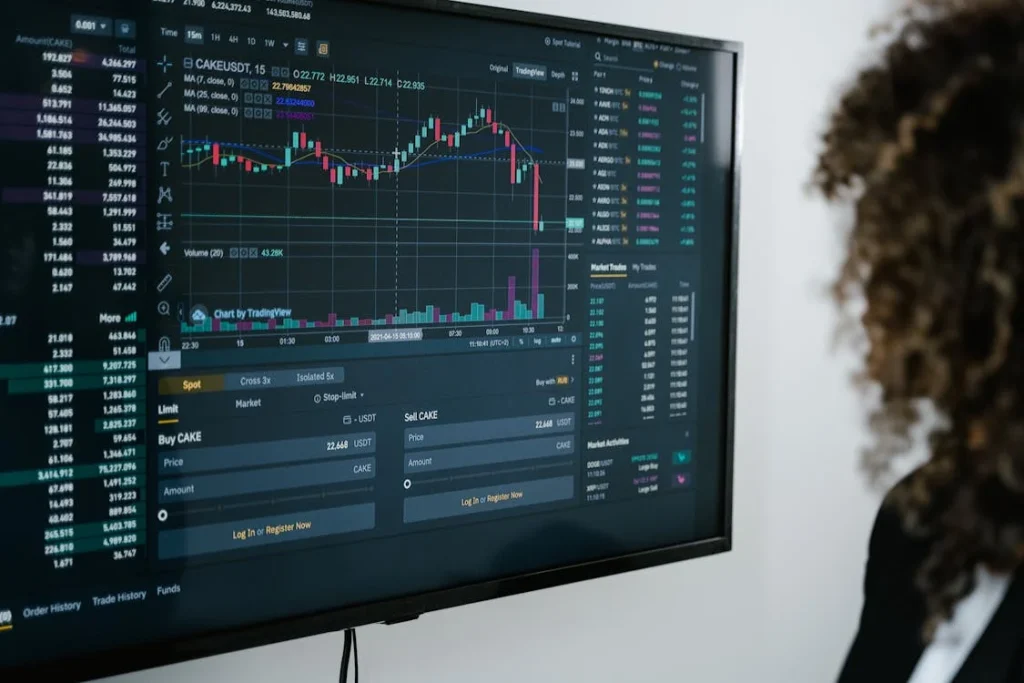
Understanding Technical Analysis

At its core, technical analysis is based on the idea that all information relevant to the market is already reflected in the price of an asset. This means that by analyzing price charts and historical data, traders can identify trends and patterns that may signal future price movements.

Unlike fundamental analysis, which focuses on economic factors, news, and geopolitical events, technical analysis is solely concerned with the price action and market sentiment. Traders use charts, indicators, and various tools to evaluate past market behavior and predict future trends.

Key Tools and Indicators in Technical Analysis

1. Price Charts

The most basic tool in technical analysis is the price chart. Price charts visually represent the price movement of an asset over a specific period. The most common types of price charts include line charts, bar charts, and candlestick charts. Candlestick charts are particularly popular among Forex traders due to the detailed information they provide about market sentiment.

2. Trend Lines and Channels

Trend lines are used to identify the direction of the market, whether it’s an uptrend, downtrend, or sideways trend. Traders draw trend lines by connecting the higher highs and higher lows in an uptrend or the lower highs and lower lows in a downtrend. Channels are parallel lines that are drawn above and below the trend line to define the range within which the price is moving.

3. Moving Averages

Moving averages are one of the most commonly used indicators in technical analysis. They smooth out price data to create a trend-following indicator that helps traders identify the direction of the market. The two most commonly used moving averages are the Simple Moving Average (SMA) and the Exponential Moving Average (EMA).

4. Relative Strength Index (RSI)

The Relative Strength Index (RSI) is a momentum oscillator that measures the speed and change of price movements. It is used to identify overbought or oversold conditions in the market. An RSI value above 70 typically signals that the market is overbought, while a value below 30 suggests that the market is oversold.

5. Bollinger Bands

Bollinger Bands consist of a simple moving average and two standard deviation lines that help traders assess market volatility. When the price moves toward the upper band, the market is considered overbought, while when it moves toward the lower band, the market is considered oversold.

Using Technical Analysis to Formulate Trading Strategies

1. Trend Following Strategy

The trend-following strategy is one of the most common methods used in technical analysis. Traders who use this strategy aim to enter trades in the direction of the prevailing trend. They look for signs of strong trends, such as breakouts, and then use indicators like moving averages or RSI to confirm the trend’s strength.

2. Breakout Trading

Breakout trading involves entering a position when the price breaks through a key level of support or resistance. Breakouts often lead to significant price movements, and traders use technical indicators such as volume and momentum oscillators to confirm the breakout’s strength.

3. Reversal Trading

Reversal trading focuses on identifying points where the market is likely to reverse direction. Traders look for patterns such as double tops, double bottoms, or head and shoulders, and use indicators like RSI or Stochastic Oscillators to confirm the reversal signal.

Advantages of Technical Analysis in Forex Trading

Technical analysis provides several advantages for Forex traders. One of the key benefits is that it can be applied to any time frame, making it suitable for day traders, swing traders, and long-term investors alike. Additionally, technical analysis is objective, as it relies on historical data and clear patterns, reducing the emotional aspect of decision-making.

Another advantage is that technical analysis allows traders to spot trends and potential price movements before they occur, giving them a potential edge in the market. By using a combination of technical indicators and chart patterns, traders can improve their chances of making profitable trades.

Limitations of Technical Analysis

While technical analysis is a powerful tool, it does have its limitations. It is not foolproof, and there is always a risk of false signals. Additionally, technical analysis relies solely on past price data, which may not always accurately predict future market conditions. Traders should combine technical analysis with sound risk management practices and, where appropriate, incorporate fundamental analysis into their trading strategy.
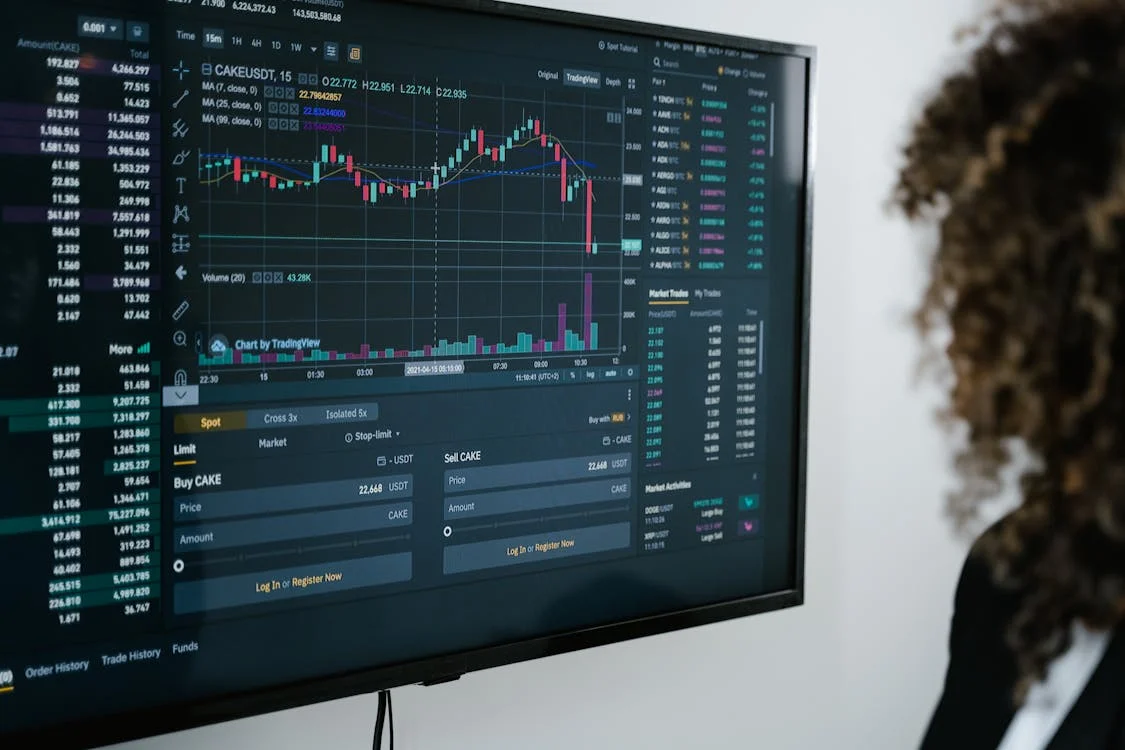
Using Technical Analysis Strategies in Forex Trading

In the world of Forex trading, where currency markets are constantly in motion, traders rely on various strategies to predict price movements. One of the most widely used approaches is technical analysis. This strategy involves analyzing historical price data, volume, and other market statistics to forecast future price movements.

In this article, we will explore the basics of technical analysis, its role in Forex trading, and some popular technical indicators and strategies that can help traders make more informed decisions.

What is Technical Analysis in Forex?

Technical analysis is a method of evaluating and forecasting the price movements of currency pairs using historical market data, primarily price charts and volume. Unlike fundamental analysis, which focuses on economic factors and news events, technical analysis looks at past price behavior to predict future trends.

Technical analysis assumes that all market information is reflected in the price and that historical price movements tend to repeat themselves. Therefore, by studying price patterns and using specific technical indicators, traders aim to predict future price action.

Key Concepts of Technical Analysis

Before diving into the specific indicators and strategies, it’s essential to understand some core concepts in technical analysis:

1. Price Charts

Price charts are the foundation of technical analysis. Traders use them to visualize past price movements and identify patterns that may signal future trends. The most common types of price charts used in Forex are:

  • Line charts: Simple charts that show closing prices over a given time period.

  • Bar charts: Provide more detailed information, showing the open, high, low, and close prices for each time period.

  • Candlestick charts: These are the most popular type of chart in Forex trading, as they offer a clear and concise visual representation of price action, including open, close, high, and low prices, with easy-to-interpret patterns.

2. Trends

In technical analysis, the concept of trends is central. A trend refers to the general direction in which the market is moving. There are three main types of trends:

  • Uptrend: When prices are generally rising.

  • Downtrend: When prices are generally falling.

  • Sideways (or Range-bound) Market: When prices move within a defined range, without a clear up or down direction.

Traders use technical analysis to identify the prevailing trend and make trading decisions based on it. The saying “the trend is your friend” is a popular motto among technical traders, highlighting the importance of trading in the direction of the trend.

3. Support and Resistance

Support and resistance are key concepts in technical analysis. Support refers to a price level at which a currency pair tends to find buying interest, preventing it from falling further. Conversely, resistance is a price level at which selling interest tends to emerge, preventing the price from rising higher.

Traders use support and resistance levels to identify potential entry and exit points, as these levels often act as barriers where price reversals can occur.

Popular Technical Indicators

Several technical indicators are commonly used by traders to help identify trends, momentum, volatility, and market strength. Below are some of the most popular technical indicators:

1. Moving Averages (MA)

Moving averages are one of the most widely used indicators in technical analysis. They smooth out price data over a specific period, helping traders identify the overall trend direction.

  • Simple Moving Average (SMA): The average of closing prices over a specific period.

  • Exponential Moving Average (EMA): Similar to SMA, but gives more weight to recent prices, making it more responsive to price changes.

Moving averages can also be used to identify potential trend reversals. For instance, a crossover occurs when a short-term moving average crosses above or below a long-term moving average, signaling a potential buy or sell opportunity.

2. Relative Strength Index (RSI)

The Relative Strength Index (RSI) is a momentum oscillator that measures the speed and change of price movements. The RSI ranges from 0 to 100, and it is typically used to identify overbought and oversold conditions.

  • Overbought: When the RSI is above 70, indicating that the currency pair may be overbought and due for a pullback.

  • Oversold: When the RSI is below 30, indicating that the currency pair may be oversold and due for a bounce.

Traders use RSI to identify potential reversal points or trend continuation signals.

3. Bollinger Bands

Bollinger Bands consist of three lines: a simple moving average (SMA) in the middle, an upper band, and a lower band. The upper and lower bands represent the standard deviation of price movements, indicating the level of volatility in the market.

  • When the price moves closer to the upper band, it may signal an overbought condition.

  • When the price moves closer to the lower band, it may signal an oversold condition.

Bollinger Bands are especially useful in volatile markets and can help traders spot breakout opportunities.

4. MACD (Moving Average Convergence Divergence)

The MACD is a trend-following momentum indicator that shows the relationship between two moving averages (the 12-day EMA and the 26-day EMA). It is used to identify potential trend reversals and momentum shifts.

  • A MACD crossover occurs when the MACD line crosses above or below the signal line, signaling a potential buy or sell opportunity.

  • The MACD histogram shows the difference between the MACD line and the signal line, helping traders gauge the strength of a trend.

The MACD is widely used for identifying the start of new trends and confirming trend continuation.

5. Fibonacci Retracement

Fibonacci retracement is a technical tool used to identify potential support and resistance levels based on the Fibonacci sequence. Traders use this tool to measure the retracement levels during a trend, identifying potential reversal points.

Common Fibonacci retracement levels are 23.6%, 38.2%, 50%, 61.8%, and 100%. Traders often look for price reversals at these levels, particularly when combined with other technical indicators.

Technical Analysis Strategies

Traders combine these technical indicators and concepts into various strategies to enhance their trading decisions. Here are a few commonly used strategies:

1. Trend Following Strategy

This strategy aims to capitalize on the continuation of an existing trend. Traders look for buy signals in an uptrend and sell signals in a downtrend. Popular tools for trend-following strategies include moving averages, RSI, and MACD.

2. Breakout Strategy

The breakout strategy involves entering a trade when the price breaks through significant support or resistance levels. Traders use Bollinger Bands or Fibonacci retracement levels to identify key breakout points.

3. Mean Reversion Strategy

The mean reversion strategy is based on the idea that price tends to return to its average or mean after moving too far in one direction. Traders use indicators like RSI or Bollinger Bands to identify overbought or oversold conditions and anticipate price reversals.

Technical Analysis in Forex Trading: Mastering the Art of Chart Analysis

Technical analysis is one of the most popular methods used by traders in the Forex market. It involves analyzing historical price data to forecast future price movements. By studying charts, patterns, and technical indicators, traders can make informed decisions about when to enter or exit the market.

In this article, we will explore what technical analysis is, why it’s so important in Forex trading, and some key techniques you can use to improve your trading strategy.

What is Technical Analysis?

Technical analysis is a method of evaluating financial markets by analyzing past market data, primarily price and volume. Unlike fundamental analysis, which looks at the economic and financial factors influencing a market, technical analysis focuses on price movements and patterns to predict future market behavior.

Technical analysts believe that all relevant information is already reflected in the price of an asset, and by studying charts, traders can identify patterns and trends that suggest where the price might move next.

Why is Technical Analysis Important in Forex Trading?

Forex markets are highly dynamic and can change rapidly due to various economic, political, and social events. Technical analysis allows traders to:

  • Identify trends: By recognizing the direction in which a currency pair is moving, traders can make decisions that align with the market trend.

  • Predict potential price movements: Using past price data, traders can forecast where the price is likely to go next, helping them make profitable trades.

  • Determine entry and exit points: Technical analysis helps traders identify optimal entry and exit levels, enhancing their trade execution.

While fundamental analysis is important for understanding the underlying factors affecting a currency, technical analysis is more commonly used for short-term trading and offers a more straightforward way of making trading decisions based on price action.

Key Components of Technical Analysis

1. Price Charts

The price chart is the foundation of technical analysis. It displays historical price movements over a specific period and is used to identify trends, patterns, and key levels of support and resistance.

Types of Price Charts:

  • Line Chart: A simple chart showing the closing prices over a period. It’s useful for identifying overall trends.

  • Bar Chart: A more detailed chart that displays the open, high, low, and close prices for each time period.

  • Candlestick Chart: A popular chart used by traders that shows the open, high, low, and close prices, with each “candlestick” representing a specific time period.

Candlestick charts provide a more detailed view of price action and help traders identify bullish and bearish trends.

2. Support and Resistance Levels

Support and resistance are critical concepts in technical analysis. These levels represent price points where the market has historically reversed its direction.

  • Support: A price level where a currency pair tends to stop falling and starts to rise again. It’s like a floor that prevents the price from dropping further.

  • Resistance: A price level where a currency pair tends to stop rising and starts to fall again. It acts like a ceiling that prevents the price from going higher.

By identifying support and resistance levels, traders can make informed decisions about when to enter or exit a trade, as these levels often act as barriers that can influence price movement.

3. Trendlines and Channels

Trendlines are used to identify the direction of the market. A trendline is drawn by connecting two or more significant price points, such as the highs or lows of a price movement.

  • Uptrend: A series of higher highs and higher lows. An uptrend line is drawn below the lows of the price to show the general direction.

  • Downtrend: A series of lower highs and lower lows. A downtrend line is drawn above the highs of the price to show the downward direction.

Channels are parallel lines drawn above and below a trendline to show the range within which the price moves. Channels help traders identify when the price is overbought or oversold and can signal potential reversals.

4. Technical Indicators

Technical indicators are mathematical calculations based on the price and volume of a currency pair. They are used to confirm trends, identify overbought or oversold conditions, and help forecast future price movements. Some of the most commonly used indicators include:

Moving Averages (MA)

A moving average smooths out price data to identify the direction of the trend. The most common types of moving averages are:

  • Simple Moving Average (SMA): The average price over a specific number of periods.

  • Exponential Moving Average (EMA): Similar to the SMA but gives more weight to recent prices.

Relative Strength Index (RSI)

The RSI is a momentum oscillator that measures the speed and change of price movements. It ranges from 0 to 100, with values above 70 indicating an overbought condition and values below 30 indicating an oversold condition.

Moving Average Convergence Divergence (MACD)

The MACD is a trend-following momentum indicator that shows the relationship between two moving averages (typically the 12-day and 26-day EMAs). It helps identify potential buy and sell signals based on crossovers.

Bollinger Bands

Bollinger Bands consist of three lines: a moving average (usually the 20-period SMA), and two standard deviation lines that represent the upper and lower limits of price movement. When the price moves outside of the bands, it may signal overbought or oversold conditions.

5. Chart Patterns

Chart patterns are visual formations created by price movements that help traders predict future price action. These patterns are typically categorized into two types: continuation patterns and reversal patterns.

  • Continuation Patterns: Indicate that the price is likely to continue in the same direction after a brief consolidation. Examples include triangles, flags, and pennants.

  • Reversal Patterns: Indicate that the price is likely to change direction. Examples include head and shoulders, double tops, and double bottoms.

By identifying chart patterns, traders can anticipate price movements and position themselves accordingly.

How to Use Technical Analysis Effectively

To use technical analysis effectively in Forex trading, traders need to combine several techniques and tools. It’s important to:

  1. Identify the trend: Start by determining whether the market is in an uptrend, downtrend, or range-bound. This will help you decide whether to buy or sell.

  2. Look for confirmation: Use technical indicators and chart patterns to confirm the direction of the trend and determine the best entry and exit points.

  3. Manage risk: Always use proper risk management techniques, such as stop-loss orders and position sizing, to protect your capital.

  4. Practice patience: Technical analysis is not about predicting every price movement but rather about identifying high-probability setups. Patience and discipline are key to success.