How to Utilize Technical Analysis in Forex Trading for Better Accuracy

Unlocking the Power of Technical Analysis in Forex Trading

Forex trading involves predicting price movements in the foreign exchange market to make profits. While there are various approaches to trading, technical analysis is one of the most commonly used methods among traders. This article will explore how technical analysis works, why it’s important, and how you can use it to improve your accuracy in Forex trading.

What is Technical Analysis in Forex Trading?

Technical analysis is the study of past price movements and trading volumes to forecast future price actions. It relies on the idea that historical price data contains all the information needed to make predictions about future price movements. Technical analysts use charts and indicators to identify patterns, trends, and market conditions that can help determine the best times to buy or sell currency pairs.

Unlike fundamental analysis, which focuses on economic and financial data to assess a currency’s value, technical analysis focuses solely on price and volume data. The primary goal is to identify price trends and reversals, which traders can capitalize on.

Key Components of Technical Analysis
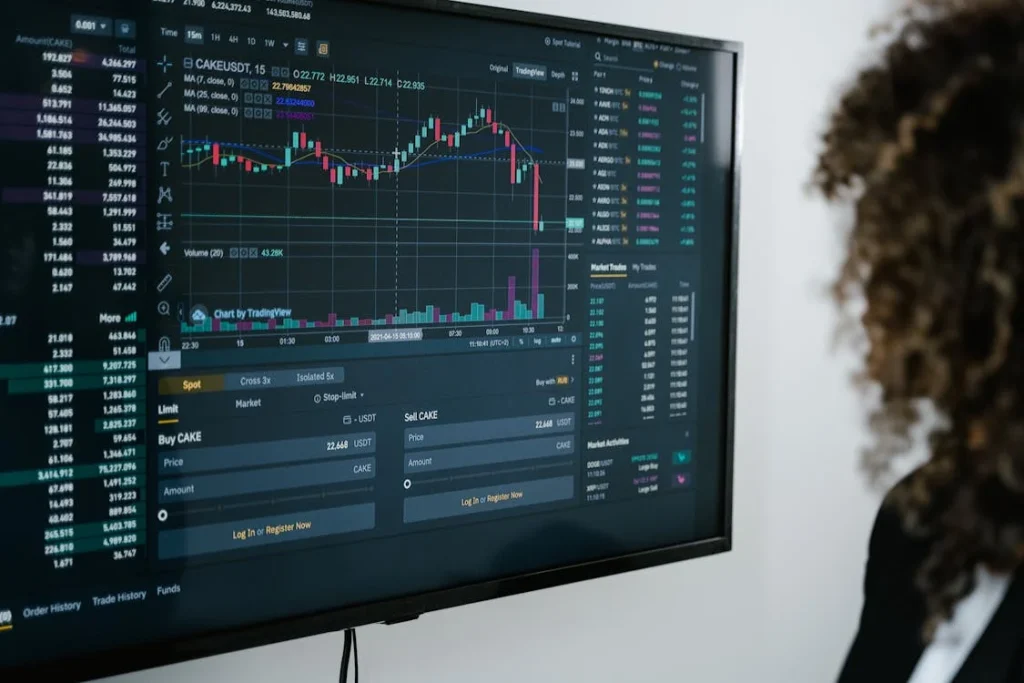
1. Price Charts

Price charts are the foundation of technical analysis. They visually represent the historical price movements of a currency pair over a specific period of time. The most commonly used types of charts are:

  • Line Charts: These are simple charts that plot the closing prices of a currency pair over time.
  • Bar Charts: These charts display the opening, closing, high, and low prices for each period.
  • Candlestick Charts: Candlestick charts provide more detailed information about price movements and are the most popular among Forex traders.

Each type of chart provides valuable insights into price trends, volatility, and patterns, helping traders make informed decisions.

2. Technical Indicators

Technical indicators are mathematical calculations based on price and volume data that are used to identify trends, momentum, volatility, and market strength. Some of the most commonly used indicators in Forex trading include:

  • Moving Averages: These indicators smooth out price data to help identify trends. Simple moving averages (SMA) and exponential moving averages (EMA) are the most common types.
  • Relative Strength Index (RSI): The RSI measures the magnitude of recent price changes to evaluate overbought or oversold conditions in a currency pair.
  • Bollinger Bands: Bollinger Bands help assess price volatility by creating a band around a moving average. When price breaks through the bands, it may indicate a potential trend reversal.
  • MACD (Moving Average Convergence Divergence): The MACD is used to determine the direction and strength of a trend by comparing two different moving averages.

By analyzing these indicators, traders can gain insights into market conditions and make more accurate predictions about future price movements.

3. Chart Patterns

Chart patterns are formations created by the price movements of a currency pair. These patterns can indicate trend reversals or continuation. Some of the most popular chart patterns include:

  • Head and Shoulders: A reversal pattern that signals the end of an uptrend or downtrend.
  • Double Top and Double Bottom: Patterns that indicate a reversal in the current trend.
  • Triangles: These patterns typically indicate a consolidation phase, with the breakout direction suggesting future price movement.

Recognizing these chart patterns allows traders to predict when a trend may reverse or continue, providing opportunities for profitable trades.

Why Technical Analysis is Important for Forex Traders

Technical analysis is essential for several reasons:

  • It helps predict market trends: Technical analysis provides valuable insights into the market’s behavior, helping traders predict the direction of price movements.
  • It eliminates emotional decision-making: Relying on technical analysis can help traders make decisions based on data and facts rather than emotions like fear or greed.
  • It provides clear entry and exit points: By using indicators, chart patterns, and trendlines, traders can identify precise entry and exit points, improving the accuracy of their trades.
  • It works in any market condition: Whether the market is trending, consolidating, or reversing, technical analysis can be applied in any market condition to help traders navigate the market.

How to Apply Technical Analysis in Your Trading Strategy

1. Identify the Trend

The first step in technical analysis is identifying the current trend. This can be done using trendlines or moving averages. Once you identify the trend, you can trade in the direction of that trend, which increases your chances of success.

2. Use Indicators to Confirm the Trend

Once you’ve identified the trend, you can use indicators such as the RSI, MACD, or Bollinger Bands to confirm that the trend is strong and likely to continue. This helps eliminate false signals and improves the accuracy of your trades.

3. Look for Chart Patterns

Chart patterns can signal potential trend reversals or breakouts. For example, a head-and-shoulders pattern may signal the end of an uptrend, while a double bottom could indicate the beginning of a new bullish trend. Recognizing these patterns helps traders enter and exit the market at the right time.

4. Set Stop-Loss and Take-Profit Levels

Using technical analysis to identify key levels of support and resistance allows traders to set effective stop-loss and take-profit levels. These levels act as a safety net, helping protect your capital in case the market moves against your position.

Conclusion

Technical analysis is a powerful tool that helps Forex traders make more accurate predictions about currency price movements. By using price charts, technical indicators, and chart patterns, traders can identify trends, entry and exit points, and market conditions that improve their trading decisions. Although technical analysis is not foolproof, when combined with sound risk management practices, it can significantly enhance a trader’s chances of success in the Forex market.

Exploring the Importance of Fundamental Analysis in Forex Trading

How to Leverage Fundamental Analysis to Improve Your Forex Trading

In the world of Forex trading, traders often use two main types of analysis to guide their trading decisions: technical analysis and fundamental analysis. While technical analysis focuses on price movements and chart patterns, fundamental analysis looks at the economic, social, and political factors that influence currency prices. In this article, we will dive deep into the importance of fundamental analysis in Forex trading and how it can enhance your trading strategy.

What is Fundamental Analysis?

Fundamental analysis in Forex trading involves analyzing the underlying economic and financial factors that affect currency values. This type of analysis considers a range of factors, such as interest rates, inflation, unemployment rates, GDP growth, and geopolitical events. The goal is to assess the overall economic health of a country and predict how these factors might influence the strength or weakness of its currency.

Unlike technical analysis, which looks at historical price data and chart patterns, fundamental analysis focuses on the intrinsic value of a currency and the overall economic conditions of the country behind it. Traders who use fundamental analysis aim to identify currencies that are undervalued or overvalued, based on economic data and news events.

Key Factors Influencing Currency Prices

1. Interest Rates

Interest rates play a major role in determining currency values. Central banks set interest rates as part of their monetary policy to control inflation and stimulate or cool down the economy. When a central bank raises interest rates, it typically strengthens the national currency, as higher rates attract foreign investment. Conversely, when interest rates are lowered, the currency often weakens, as the returns on investments become less attractive.

2. Inflation Rates

Inflation is another critical factor in currency valuation. A country with high inflation typically experiences a depreciation of its currency because inflation erodes the purchasing power of the currency. Conversely, a country with low inflation tends to have a stronger currency, as its purchasing power remains stable. Forex traders closely monitor inflation data, such as the Consumer Price Index (CPI), to assess the impact on currency movements.

3. Economic Indicators

Economic indicators, such as GDP growth, employment reports, and industrial production, provide insights into the overall health of an economy. Strong economic performance often leads to a stronger currency, as it reflects the country’s growth potential and attractiveness to investors. On the other hand, weak economic indicators can lead to a weaker currency as investors may seek more stable economies.

4. Political Events and Geopolitical Risks

Political events and geopolitical risks can have a significant impact on currency prices. Elections, government policy changes, trade negotiations, and geopolitical tensions can all influence market sentiment and cause currency fluctuations. Traders must stay informed about these events and understand their potential impact on the Forex market.

How to Use Fundamental Analysis in Your Trading Strategy

1. Economic Calendar

One of the most valuable tools for traders using fundamental analysis is the economic calendar. The economic calendar lists key economic events, reports, and data releases that can move the markets. By keeping track of important events, such as interest rate decisions, GDP reports, and employment data, traders can anticipate market reactions and adjust their trading strategies accordingly.

2. Central Bank Policies

Central banks have a direct influence on currency prices through their monetary policies. Traders who follow central bank announcements, such as changes in interest rates or monetary tightening/easing, can gain insights into the direction of a currency’s value. For example, if a central bank signals that it plans to raise interest rates, traders may buy the currency in anticipation of its appreciation.

3. Economic Reports and News Releases

Forex traders closely monitor economic reports and news releases to gauge the strength of a country’s economy. Key reports include GDP growth, employment data, inflation figures, and trade balances. These reports provide a snapshot of the overall economic conditions and can lead to significant currency price movements.

4. Market Sentiment and News Analysis

Understanding market sentiment is essential for applying fundamental analysis in Forex trading. News events, such as geopolitical tensions, natural disasters, or economic crises, can cause drastic shifts in market sentiment. Traders need to be aware of how news and events can affect investor behavior and drive currency price fluctuations.

The Advantages of Fundamental Analysis in Forex Trading

There are several advantages to using fundamental analysis in Forex trading:

  • Long-term trends: Fundamental analysis is particularly useful for identifying long-term trends in the Forex market. By assessing the underlying economic conditions, traders can anticipate currency movements over weeks, months, or even years.
  • Informed decision-making: Fundamental analysis provides traders with a deeper understanding of the factors that influence currency prices. This allows traders to make more informed decisions based on the economic outlook of a country.
  • Less reliance on technical analysis: By focusing on the economic fundamentals, traders can reduce their reliance on technical analysis. This approach can be especially useful when technical signals are ambiguous or contradictory.

Challenges of Fundamental Analysis

While fundamental analysis is a powerful tool, it does come with some challenges:

  • Complexity: Fundamental analysis requires a deep understanding of economic indicators, central bank policies, and global events. This can be overwhelming for beginner traders who may find it difficult to keep up with all the information.
  • Timing: The impact of economic data or news events can take time to materialize in currency prices. Traders need to be patient and wait for the right opportunities to enter or exit the market.
  • Market reactions: While economic data and news events provide valuable insights, the market’s reaction to these factors can be unpredictable. In some cases, the market may react to news in ways that don’t align with the fundamentals.

How to Use Risk Management in Forex Trading to Protect Your Capital

Protecting Your Capital: Mastering Risk Management in Forex Trading

One of the most crucial aspects of successful Forex trading is risk management. In an environment as volatile as the Forex market, understanding how to protect your capital is vital for long-term success. This article will explore the importance of risk management and the various strategies traders can employ to safeguard their investments while maximizing their potential profits.

Why Risk Management is Critical in Forex Trading

Forex trading offers enormous profit potential, but it also comes with significant risks. The market can be unpredictable, and small movements in currency prices can lead to large profits or losses. Without proper risk management, traders can easily lose their entire capital, especially if they don’t account for market volatility.

Risk management helps traders minimize losses while maximizing the chances of making profitable trades. It involves implementing strategies and tools that allow traders to control how much capital they’re willing to risk on each trade. This reduces the emotional stress of trading and enables traders to stick to their strategies with a clear mind.

Key Risk Management Strategies for Forex Traders

1. Setting Stop-Loss Orders

One of the most fundamental tools for risk management is the stop-loss order. A stop-loss order automatically closes a position when the price reaches a certain level, limiting potential losses. By setting stop-loss levels, traders can ensure that they don’t lose more money than they are comfortable with on any single trade.

It’s essential to set stop-loss levels based on market conditions and volatility, as a poorly placed stop-loss can result in an unnecessary loss. Many traders place stop-losses at key support or resistance levels for added protection.

2. Position Sizing

Position sizing refers to the amount of capital a trader allocates to a particular trade. The key to effective position sizing is to ensure that the risk on each trade is a small percentage of your overall trading capital. Most professional traders risk only 1-2% of their account balance on a single trade.

By using proper position sizing, traders can withstand a series of losses without significantly impacting their overall capital. It’s important to adjust your position size based on the volatility of the currency pair you are trading and the size of your stop-loss.

3. Risk-to-Reward Ratio

The risk-to-reward ratio is a measure of how much potential profit you stand to make compared to how much you are willing to risk on a trade. For example, a 1:2 risk-to-reward ratio means that for every $1 you risk, you aim to make $2 in profit. Many traders aim for a risk-to-reward ratio of at least 1:2, meaning the potential reward is twice the amount of the potential risk.

Maintaining a favorable risk-to-reward ratio ensures that even if you have a lower win rate, your profitable trades will more than compensate for the losses.

4. Diversification

Diversification involves spreading your investments across multiple assets or currency pairs to reduce the overall risk. By diversifying your portfolio, you can avoid the risk of relying on a single trade or currency pair to generate profits. This strategy helps reduce the impact of losses on your overall capital, as one losing position will not wipe out all your profits.

However, it’s important not to over-diversify, as this can lead to confusion and diluted focus. Focus on a few high-quality trades and apply risk management principles to each one.

5. Keeping a Trading Journal

Another valuable risk management strategy is maintaining a trading journal. This allows you to track your trades, including entry and exit points, stop-loss levels, and the reasoning behind each decision. By reviewing your journal regularly, you can identify patterns in your trading behavior and adjust your strategy accordingly.

Additionally, journaling helps you stay disciplined and avoid emotional decisions that can lead to risky trades.

The Psychological Aspect of Risk Management

Risk management in Forex trading is not just about numbers and tools; it’s also about controlling your emotions. Many traders fall victim to emotional decision-making, which often leads to higher risk-taking and poor outcomes. Fear of missing out (FOMO) and greed can cause traders to take unnecessary risks, while the fear of loss can lead to premature exits from profitable trades.

Successful traders learn to control their emotions by sticking to their trading plan and risk management rules. It’s important to accept that losses are part of the game and that no trader can win every trade. By focusing on long-term consistency rather than short-term gains, traders can avoid impulsive decisions that jeopardize their capital.

Final Thoughts

Risk management is an essential aspect of Forex trading that separates successful traders from those who eventually blow their accounts. By utilizing stop-loss orders, controlling position sizes, maintaining a favorable risk-to-reward ratio, and diversifying your trades, you can protect your capital and improve your long-term profitability.

Furthermore, understanding the psychological aspects of risk management is key to developing a disciplined approach to trading. With the right mindset and strategies, you can reduce the impact of losses and make more informed decisions in the Forex market.

The Role of Technical Analysis in Forex Trading: A Comprehensive Guide

Mastering Forex Market Trends with Technical Analysis

Technical analysis is one of the most essential tools for Forex traders looking to make informed decisions in the market. It involves the study of past market data, primarily price and volume, to forecast future market movements. This guide will explore the role of technical analysis in Forex trading, providing insights into key concepts, tools, and strategies that traders use to gain an edge in the market.

Understanding Technical Analysis

At its core, technical analysis is based on the idea that all information relevant to the market is already reflected in the price of an asset. This means that by analyzing price charts and historical data, traders can identify trends and patterns that may signal future price movements.

Unlike fundamental analysis, which focuses on economic factors, news, and geopolitical events, technical analysis is solely concerned with the price action and market sentiment. Traders use charts, indicators, and various tools to evaluate past market behavior and predict future trends.

Key Tools and Indicators in Technical Analysis

1. Price Charts

The most basic tool in technical analysis is the price chart. Price charts visually represent the price movement of an asset over a specific period. The most common types of price charts include line charts, bar charts, and candlestick charts. Candlestick charts are particularly popular among Forex traders due to the detailed information they provide about market sentiment.

2. Trend Lines and Channels

Trend lines are used to identify the direction of the market, whether it’s an uptrend, downtrend, or sideways trend. Traders draw trend lines by connecting the higher highs and higher lows in an uptrend or the lower highs and lower lows in a downtrend. Channels are parallel lines that are drawn above and below the trend line to define the range within which the price is moving.

3. Moving Averages

Moving averages are one of the most commonly used indicators in technical analysis. They smooth out price data to create a trend-following indicator that helps traders identify the direction of the market. The two most commonly used moving averages are the Simple Moving Average (SMA) and the Exponential Moving Average (EMA).

4. Relative Strength Index (RSI)

The Relative Strength Index (RSI) is a momentum oscillator that measures the speed and change of price movements. It is used to identify overbought or oversold conditions in the market. An RSI value above 70 typically signals that the market is overbought, while a value below 30 suggests that the market is oversold.

5. Bollinger Bands

Bollinger Bands consist of a simple moving average and two standard deviation lines that help traders assess market volatility. When the price moves toward the upper band, the market is considered overbought, while when it moves toward the lower band, the market is considered oversold.

Using Technical Analysis to Formulate Trading Strategies

1. Trend Following Strategy

The trend-following strategy is one of the most common methods used in technical analysis. Traders who use this strategy aim to enter trades in the direction of the prevailing trend. They look for signs of strong trends, such as breakouts, and then use indicators like moving averages or RSI to confirm the trend’s strength.

2. Breakout Trading

Breakout trading involves entering a position when the price breaks through a key level of support or resistance. Breakouts often lead to significant price movements, and traders use technical indicators such as volume and momentum oscillators to confirm the breakout’s strength.

3. Reversal Trading

Reversal trading focuses on identifying points where the market is likely to reverse direction. Traders look for patterns such as double tops, double bottoms, or head and shoulders, and use indicators like RSI or Stochastic Oscillators to confirm the reversal signal.

Advantages of Technical Analysis in Forex Trading

Technical analysis provides several advantages for Forex traders. One of the key benefits is that it can be applied to any time frame, making it suitable for day traders, swing traders, and long-term investors alike. Additionally, technical analysis is objective, as it relies on historical data and clear patterns, reducing the emotional aspect of decision-making.

Another advantage is that technical analysis allows traders to spot trends and potential price movements before they occur, giving them a potential edge in the market. By using a combination of technical indicators and chart patterns, traders can improve their chances of making profitable trades.

Limitations of Technical Analysis

While technical analysis is a powerful tool, it does have its limitations. It is not foolproof, and there is always a risk of false signals. Additionally, technical analysis relies solely on past price data, which may not always accurately predict future market conditions. Traders should combine technical analysis with sound risk management practices and, where appropriate, incorporate fundamental analysis into their trading strategy.

Unlocking Success in Forex Trading: Mastering Emotions for Better Decisions

Emotional Control: The Key to Forex Trading Success

Forex trading is as much a psychological game as it is a technical one. While traders often focus on charts, indicators, and market trends, emotional control is equally essential to make the right decisions. This article explores how mastering your emotions can improve your decision-making process and lead you to greater success in the Forex market.

The Role of Emotions in Forex Trading

Traders often think that success in Forex comes from following a perfect strategy or predicting the right market direction. However, what most fail to realize is that emotions like fear, greed, and overconfidence can significantly impact their trading performance. These emotions can distort judgment, resulting in poor trading decisions. Recognizing the influence of these feelings is the first step toward successful trading.

Common Emotional Pitfalls in Forex Trading

1. Fear of Losing

Fear of losing money is a common emotion that all traders face at some point. This fear often leads to hesitation in entering trades or prematurely closing positions out of anxiety. Fear of loss can cloud judgment, causing traders to second-guess their decisions or avoid taking necessary risks.

To manage this fear, traders should rely on a clear trading plan and stick to their strategy, regardless of market fluctuations.

2. Greed for Quick Gains

Greed is another emotion that can lead traders astray. The desire for quick profits often encourages traders to take excessive risks, over-leverage, or chase after trades without proper analysis. While the potential for high returns may be enticing, greed can lead to heavy losses if not kept in check.

To curb greed, traders should focus on long-term gains, set realistic profit targets, and avoid deviating from their trading plan in the pursuit of rapid rewards.

3. Overconfidence and Impulsiveness

After experiencing a few successful trades, traders might develop overconfidence, leading them to make impulsive decisions. This often results in ignoring risk management rules or entering trades without proper analysis. Overconfidence can also lead to the belief that one can control the market, a dangerous mindset in Forex trading.

Traders must remind themselves that no market is predictable, and humility is essential in the face of market uncertainty.

Effective Strategies to Control Emotions

1. Create a Well-Defined Trading Plan

A comprehensive trading plan is crucial for managing emotions. The plan should outline entry and exit points, risk management rules, and clear goals. Having a strategy in place helps remove emotional biases and provides a systematic approach to trading.

2. Practice Emotional Detachment

One of the best ways to manage emotions is by developing emotional detachment from the outcome of each trade. This means viewing each trade as part of a larger strategy rather than as a personal win or loss. By focusing on the process and not the immediate result, traders can avoid making rash decisions driven by emotion.

3. Use Automated Tools for Risk Management

To further reduce emotional interference, traders can implement automated trading tools that execute trades based on predetermined criteria. Using stop-loss orders and take-profit targets can help limit losses and lock in profits, removing the need for emotional decision-making when the market moves against or in your favor.

How to Analyze Forex Price Action: A Step-by-Step Guide

Price action is one of the most fundamental and effective methods for analyzing Forex markets. Unlike relying on indicators or complex technical tools, price action analysis focuses on understanding market behavior through the price movements themselves. This guide will break down how to use price action effectively to make better trading decisions.

What is Price Action in Forex Trading?

Price action refers to the movement of prices over time. It is often viewed through charts, allowing traders to observe how the price of a currency pair behaves within a specific time frame. By analyzing price patterns, traders aim to predict future price movements based on historical behavior.

Price action is often considered “pure” technical analysis since it does not depend on indicators. Instead, it uses the raw data of price movements to generate trading insights.

Key Components of Price Action Analysis

1. Candlestick Patterns

Candlestick patterns are one of the most important tools in price action trading. These patterns provide valuable insights into market sentiment and potential price direction. Common patterns include doji, engulfing, pin bars, and hammers.

2. Support and Resistance Levels

Support and resistance are horizontal lines drawn on a chart to indicate levels where the price has historically reversed or stalled. Identifying these levels helps traders understand where the price might reverse or break through, providing clues for entry and exit points.

3. Trendlines

Trendlines are drawn on a chart to indicate the general direction of price movements. They are used to identify trends — whether the market is moving upward, downward, or sideways. By connecting highs and lows, traders can track price movements and predict potential changes in direction.

4. Market Structure

Market structure refers to the overall pattern of the market, including higher highs, higher lows (uptrend), lower highs, lower lows (downtrend), and sideways patterns (range-bound). Recognizing the market structure helps traders determine whether to buy or sell.

How to Use Price Action for Trading Decisions

Using price action for trading decisions requires a deep understanding of market psychology and patience. Here are some steps to help you get started:

1. Identify the Trend

The first step in price action analysis is identifying the prevailing market trend. Is the market in an uptrend, downtrend, or sideways? Look for clear patterns in the price data to determine the trend’s direction.

2. Look for Reversal Patterns

Reversal patterns, such as double tops, double bottoms, and head and shoulders, provide potential entry points. These patterns signal a shift in market direction and are often used by traders to predict trend changes.

3. Wait for Confirmation

While price action can provide valuable insights, waiting for confirmation of a trade setup is essential. This can come in the form of a break of support or resistance, or a candlestick pattern that confirms the move. Never enter a trade on the basis of a single price action signal alone.

4. Use Risk Management

Even with price action, risk management is crucial. Always use stop-loss orders to protect your capital, and manage your position size based on your risk tolerance. This will help you limit losses and protect your account in volatile markets.

Common Price Action Mistakes to Avoid

  • Relying on Single Signals: Don’t base your trades on a single candlestick pattern or price movement. Always look for confirmation.
  • Ignoring Market Context: Price action analysis should be performed within the context of broader market conditions, not in isolation.
  • Overtrading: Don’t trade too frequently in the hope of catching every small price movement. Be selective about your trades.