Types of Forex Orders: A Complete Guide for Traders

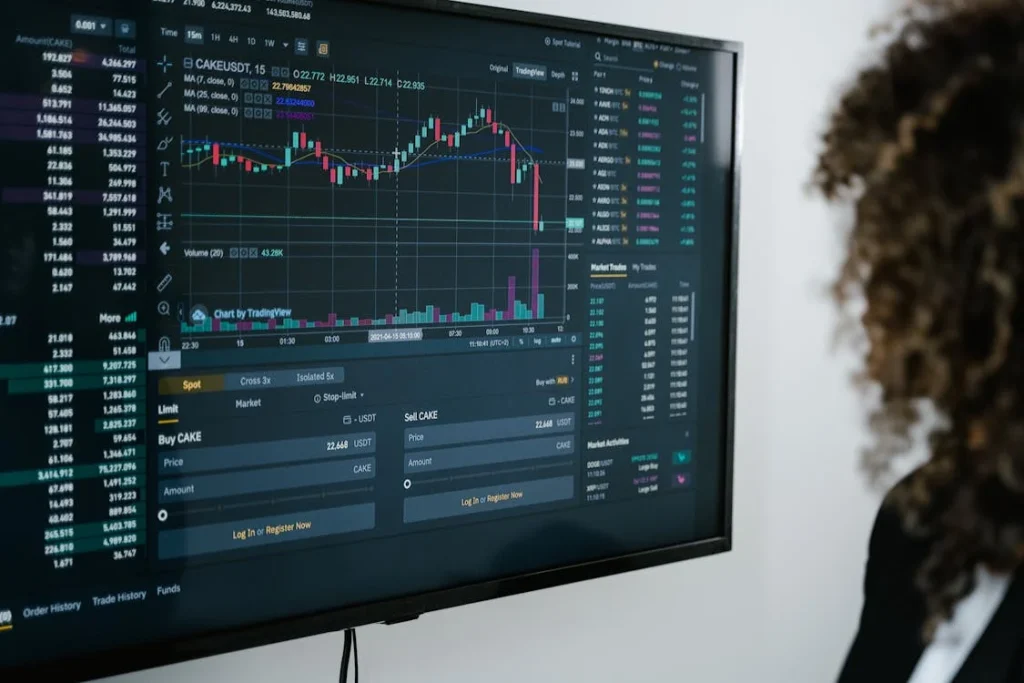
Entering and exiting trades in the Forex market requires more than just choosing a currency pair and setting a direction. Traders need to understand the different types of orders available to execute their strategies effectively. Using the right type of order can significantly impact the outcome of a trade, helping traders manage risk and seize opportunities more precisely.

In this article, we’ll explore the main types of Forex orders, how they work, and when to use each one.

What is a Forex Order?

A Forex order is an instruction that a trader gives to their broker to buy or sell a currency pair under specific conditions. Orders can be executed immediately or set to trigger in the future once certain market criteria are met.

Understanding how each order type works enables traders to plan their entries and exits more strategically and protect their trading capital.

Main Types of Forex Orders

1. Market Order

A market order is the simplest and most common type of Forex order. It instructs the broker to buy or sell a currency pair immediately at the best available price.

When to use:

  • When you want instant execution.

  • In highly liquid markets where price slippage is minimal.

Example:
You see EUR/USD rising sharply and want to enter immediately; you place a market order to buy at the current price.

2. Limit Order

A limit order is used to buy or sell a currency pair at a specific price or better. A buy limit order is placed below the current market price, while a sell limit order is placed above the current market price.

When to use:

  • When you want to enter the market at a more favorable price.

  • When expecting a retracement before the trend continues.

Example:
If EUR/USD is trading at 1.1000 and you want to buy it if it drops to 1.0950, you set a buy limit order at 1.0950.

3. Stop Order

A stop order becomes a market order once a certain price is reached. A buy stop order is placed above the current market price, and a sell stop order is placed below the current market price.

When to use:

  • To enter trades when the market moves beyond a certain level.

  • As part of breakout trading strategies.

Example:
If EUR/USD is at 1.1000 and you expect a strong move up if it reaches 1.1050, you place a buy stop order at 1.1050.

4. Stop-Loss Order

A stop-loss order is a protective order to limit losses on a trade. It automatically closes a trade when the price moves against you by a specified amount.

When to use:

  • Always, to protect your capital from large losses.

Example:
You buy EUR/USD at 1.1000 and place a stop-loss at 1.0950, limiting your risk to 50 pips.

5. Take-Profit Order

A take-profit order automatically closes a trade once the market reaches a predetermined profit target. It helps traders lock in gains without constantly monitoring the market.

When to use:

  • When you want to secure profits at a specific price level.

Example:
You buy EUR/USD at 1.1000 and set a take-profit at 1.1100 to capture 100 pips profit.

6. Trailing Stop Order

A trailing stop is a dynamic stop-loss order that moves with the market price when it moves favorably but stays fixed if the price moves against you.

When to use:

  • To lock in profits while allowing room for further gains.

  • In trending markets where you expect continued movement.

Example:
You set a trailing stop 30 pips below the market price. If the market rises, your stop-loss follows the price upward, protecting your profits.

Other Specialized Orders

  • OCO Order (One Cancels the Other): Combines two orders where if one order is executed, the other is automatically canceled.

  • GTC Order (Good Till Canceled): An order that remains active until you manually cancel it.

  • FOK Order (Fill or Kill): An order that must be filled immediately in its entirety or canceled.

Choosing the Right Order Type

The type of order you choose depends on:

  • Your trading strategy (scalping, day trading, swing trading, etc.)

  • Your risk tolerance.

  • Market conditions (volatile or stable).

  • Whether you want manual or automated execution.

Professional traders often combine multiple order types within a single trading plan to optimize their results and manage risks effectively.

News Trading in Forex: Strategies and the Impact of Economic Events

Forex trading offers a wide range of strategies for profit, but one of the most dynamic and often highly rewarding methods is news trading. This strategy involves capitalizing on market movements caused by economic news releases and geopolitical events. News trading can be volatile and fast-paced, requiring traders to stay updated and react quickly to breaking news.

In this article, we will explore the concept of news trading in Forex, the most influential news events, and some strategies traders use to profit from market reactions to economic announcements.

What is News Trading in Forex?

News trading in Forex refers to the strategy of entering and exiting trades based on economic news releases and major events that affect the financial markets. Economic reports such as GDP figures, unemployment data, and central bank decisions can trigger sharp market moves, making them prime opportunities for news traders.

The core idea of news trading is to react quickly to these events by predicting how the market will respond. Traders who excel at news trading use advanced analysis to determine the likely direction of price movements once the news is released.

Key Economic Events That Impact Forex

Several types of economic events and news releases have a significant impact on the Forex market. Here are some of the most crucial news events that can trigger sharp price movements:

1. Central Bank Announcements

Central banks, such as the Federal Reserve (USA), the European Central Bank (ECB), and the Bank of England (BoE), play a critical role in the Forex market. Their decisions regarding interest rates and monetary policy have a direct influence on currency values.

For example, if the Federal Reserve raises interest rates, the US dollar typically strengthens because higher interest rates attract foreign capital. Conversely, a rate cut might weaken the dollar.

2. GDP Reports

The Gross Domestic Product (GDP) report measures the economic output of a country. GDP growth signals a strong economy, which typically strengthens the currency of that country, while a contraction signals a weaker economy.

Traders closely monitor GDP data releases to gauge the overall health of an economy. Strong GDP growth usually causes a rise in the domestic currency, while a poor GDP report can lead to a currency depreciation.

3. Employment Data

Employment reports, such as the Non-Farm Payrolls (NFP) in the United States or the unemployment rate, provide valuable insights into the labor market. Strong job growth suggests a growing economy, which is usually bullish for the currency. Conversely, a weaker employment report can lead to a currency sell-off.

The NFP report, released monthly, often causes significant volatility in the USD pairs, making it a major event for news traders.

4. Inflation Data (CPI)

The Consumer Price Index (CPI) measures the change in the price of goods and services and is a key indicator of inflation. Central banks are concerned with inflation rates as they influence interest rate decisions. High inflation might lead to a tightening of monetary policy, which can strengthen the currency.

Traders monitor CPI data to anticipate changes in central bank policy, which can drive currency price movements.

5. Geopolitical Events

In addition to economic data, geopolitical events can significantly influence Forex markets. Natural disasters, political elections, trade negotiations, and military conflicts can cause market uncertainty, which often results in price volatility.

For instance, political instability in a country can lead to a sell-off of that nation’s currency as investors seek safer assets, such as the US dollar or gold.

Strategies for News Trading in Forex

News trading requires a fast-paced and often reactive approach. Traders who succeed in this strategy are able to capitalize on price movements before the majority of market participants react. Here are some popular strategies used by news traders:

1. Straddle Strategy

The straddle strategy involves placing two orders before a major news release: one buy order above the current market price and one sell order below the current price. This strategy aims to profit from a large price movement in either direction, regardless of whether the news is positive or negative.

For example, before the release of an employment report, a trader would place a buy order just above the current market price and a sell order just below. When the news is released, the price usually moves sharply in one direction, and the trader can capture that movement.

2. Pre-News Positioning

Some traders prefer to take a position before the news event based on their analysis of the likely outcome. For instance, if a trader expects the Federal Reserve to raise interest rates, they might buy USD before the announcement is made.

This strategy requires an accurate understanding of the market’s expectations and the timing of news releases. It’s important to consider the risks of trading before a news release, as surprises can lead to significant losses.

3. Post-News Reaction Trading

Post-news reaction trading is a strategy where traders wait for the market to respond to the news before taking a position. Instead of rushing in immediately after the news is released, traders wait for the initial volatility to subside and then place a trade in the direction of the market’s reaction.

For example, after an interest rate hike by the ECB, the trader may wait for the initial spike in volatility to settle and then enter a buy trade if the market maintains an upward movement in the euro.

4. Trading the News on the High-Impact Pairs

News traders often focus on major currency pairs, such as EUR/USD, GBP/USD, and USD/JPY, as they tend to experience the most significant movements during economic news releases. These pairs are highly liquid and less prone to slippage, making them ideal for news trading.

5. Risk Management

Risk management is critical when trading news events because the volatility following news releases can be unpredictable. Traders should use stop-loss orders to limit potential losses, and position sizing should be carefully managed to avoid significant drawdowns during periods of high volatility.

Traders often use tight stop-loss levels and take-profit targets to lock in profits before the market moves too far against them.

Tips for Successful News Trading

  • Stay Informed: Keep track of the economic calendar to know when important news releases are scheduled. Websites such as Forex Factory and Investing.com provide calendars with upcoming economic events.

  • Be Aware of Market Expectations: It’s not just the actual data that matters but how it compares to market expectations. News releases that surprise the market can lead to larger price movements.

  • Prepare for Volatility: News trading can be very volatile, so always be prepared for sharp price swings. Avoid over-leveraging your positions.

  • Test Your Strategy: Before trading news releases with real money, practice your strategy on a demo account. This will help you understand the market’s behavior and develop a feel for the volatility around news events.

Using Technical Analysis Strategies in Forex Trading

In the world of Forex trading, where currency markets are constantly in motion, traders rely on various strategies to predict price movements. One of the most widely used approaches is technical analysis. This strategy involves analyzing historical price data, volume, and other market statistics to forecast future price movements.

In this article, we will explore the basics of technical analysis, its role in Forex trading, and some popular technical indicators and strategies that can help traders make more informed decisions.

What is Technical Analysis in Forex?

Technical analysis is a method of evaluating and forecasting the price movements of currency pairs using historical market data, primarily price charts and volume. Unlike fundamental analysis, which focuses on economic factors and news events, technical analysis looks at past price behavior to predict future trends.

Technical analysis assumes that all market information is reflected in the price and that historical price movements tend to repeat themselves. Therefore, by studying price patterns and using specific technical indicators, traders aim to predict future price action.

Key Concepts of Technical Analysis

Before diving into the specific indicators and strategies, it’s essential to understand some core concepts in technical analysis:

1. Price Charts

Price charts are the foundation of technical analysis. Traders use them to visualize past price movements and identify patterns that may signal future trends. The most common types of price charts used in Forex are:

  • Line charts: Simple charts that show closing prices over a given time period.

  • Bar charts: Provide more detailed information, showing the open, high, low, and close prices for each time period.

  • Candlestick charts: These are the most popular type of chart in Forex trading, as they offer a clear and concise visual representation of price action, including open, close, high, and low prices, with easy-to-interpret patterns.

2. Trends

In technical analysis, the concept of trends is central. A trend refers to the general direction in which the market is moving. There are three main types of trends:

  • Uptrend: When prices are generally rising.

  • Downtrend: When prices are generally falling.

  • Sideways (or Range-bound) Market: When prices move within a defined range, without a clear up or down direction.

Traders use technical analysis to identify the prevailing trend and make trading decisions based on it. The saying “the trend is your friend” is a popular motto among technical traders, highlighting the importance of trading in the direction of the trend.

3. Support and Resistance

Support and resistance are key concepts in technical analysis. Support refers to a price level at which a currency pair tends to find buying interest, preventing it from falling further. Conversely, resistance is a price level at which selling interest tends to emerge, preventing the price from rising higher.

Traders use support and resistance levels to identify potential entry and exit points, as these levels often act as barriers where price reversals can occur.

Popular Technical Indicators

Several technical indicators are commonly used by traders to help identify trends, momentum, volatility, and market strength. Below are some of the most popular technical indicators:

1. Moving Averages (MA)

Moving averages are one of the most widely used indicators in technical analysis. They smooth out price data over a specific period, helping traders identify the overall trend direction.

  • Simple Moving Average (SMA): The average of closing prices over a specific period.

  • Exponential Moving Average (EMA): Similar to SMA, but gives more weight to recent prices, making it more responsive to price changes.

Moving averages can also be used to identify potential trend reversals. For instance, a crossover occurs when a short-term moving average crosses above or below a long-term moving average, signaling a potential buy or sell opportunity.

2. Relative Strength Index (RSI)

The Relative Strength Index (RSI) is a momentum oscillator that measures the speed and change of price movements. The RSI ranges from 0 to 100, and it is typically used to identify overbought and oversold conditions.

  • Overbought: When the RSI is above 70, indicating that the currency pair may be overbought and due for a pullback.

  • Oversold: When the RSI is below 30, indicating that the currency pair may be oversold and due for a bounce.

Traders use RSI to identify potential reversal points or trend continuation signals.

3. Bollinger Bands

Bollinger Bands consist of three lines: a simple moving average (SMA) in the middle, an upper band, and a lower band. The upper and lower bands represent the standard deviation of price movements, indicating the level of volatility in the market.

  • When the price moves closer to the upper band, it may signal an overbought condition.

  • When the price moves closer to the lower band, it may signal an oversold condition.

Bollinger Bands are especially useful in volatile markets and can help traders spot breakout opportunities.

4. MACD (Moving Average Convergence Divergence)

The MACD is a trend-following momentum indicator that shows the relationship between two moving averages (the 12-day EMA and the 26-day EMA). It is used to identify potential trend reversals and momentum shifts.

  • A MACD crossover occurs when the MACD line crosses above or below the signal line, signaling a potential buy or sell opportunity.

  • The MACD histogram shows the difference between the MACD line and the signal line, helping traders gauge the strength of a trend.

The MACD is widely used for identifying the start of new trends and confirming trend continuation.

5. Fibonacci Retracement

Fibonacci retracement is a technical tool used to identify potential support and resistance levels based on the Fibonacci sequence. Traders use this tool to measure the retracement levels during a trend, identifying potential reversal points.

Common Fibonacci retracement levels are 23.6%, 38.2%, 50%, 61.8%, and 100%. Traders often look for price reversals at these levels, particularly when combined with other technical indicators.

Technical Analysis Strategies

Traders combine these technical indicators and concepts into various strategies to enhance their trading decisions. Here are a few commonly used strategies:

1. Trend Following Strategy

This strategy aims to capitalize on the continuation of an existing trend. Traders look for buy signals in an uptrend and sell signals in a downtrend. Popular tools for trend-following strategies include moving averages, RSI, and MACD.

2. Breakout Strategy

The breakout strategy involves entering a trade when the price breaks through significant support or resistance levels. Traders use Bollinger Bands or Fibonacci retracement levels to identify key breakout points.

3. Mean Reversion Strategy

The mean reversion strategy is based on the idea that price tends to return to its average or mean after moving too far in one direction. Traders use indicators like RSI or Bollinger Bands to identify overbought or oversold conditions and anticipate price reversals.

Scalping in Forex Trading: Quick Profits in Fast Markets

Forex trading is a dynamic and volatile market, and traders use various strategies to profit from price movements. One of the most popular and exciting strategies is scalping. Scalping in Forex refers to making multiple trades in a short time, aiming to capture small price movements.

In this article, we will dive into what scalping is, how it works, and why it’s becoming a favorite strategy for many Forex traders. We’ll also explore some techniques and the best conditions for scalping, as well as its advantages and potential drawbacks.

What is Scalping in Forex?

Scalping is a strategy that involves making numerous quick trades throughout the day. These trades usually last for a few seconds to a few minutes. The goal of scalping is to capture small price movements that add up over time, accumulating significant profits with many trades.

Scalpers focus on highly liquid currency pairs, such as EUR/USD or GBP/USD, because these pairs offer the small price movements needed for this strategy. Unlike longer-term traders who may hold positions for hours or days, scalpers prefer to get in and out of the market quickly.

How Does Scalping Work?

Scalping in Forex is typically done with a very short time frame. Traders who use this strategy monitor charts in real-time to identify opportunities where price movements are small but frequent. The key idea is to execute quick trades based on minute price changes.

To successfully scalp, a trader must:

  • Use tight spreads: Narrow spreads ensure that traders can enter and exit positions quickly without significant slippage.

  • Utilize leverage: Since the profit per trade is small, leverage is often used to magnify gains.

  • Monitor multiple timeframes: Scalpers typically use 1-minute or 5-minute charts to spot quick opportunities.

For example, a scalper might enter a trade on the EUR/USD when they see a 5-pip movement in their favor and exit the trade once they’ve made a small profit of 5 to 10 pips. They then repeat the process several times throughout the day.

Advantages of Scalping

1. Quick Profits

The primary advantage of scalping is the ability to make fast profits. Since scalpers aim for small price movements, they can complete multiple trades in a single day, accumulating small profits that add up over time. This strategy allows for rapid returns, especially in volatile markets.

2. Less Exposure to Market Risk

Scalpers hold their positions for very short periods, often just a few minutes, which means they’re exposed to less market risk compared to longer-term traders. This reduced exposure to the market can be beneficial during times of high volatility when large price swings may occur.

3. Suitable for Volatile Markets

Scalping works best in markets with high volatility. The Forex market is known for its frequent price fluctuations, especially in the most liquid pairs. Scalpers can take advantage of these small fluctuations to generate consistent profits.

4. Low Capital Requirement

Because the goal of scalping is to capture small profits, traders don’t need a large capital base to be successful. The small profits made on each trade can accumulate into meaningful gains without requiring significant capital investment.

Challenges and Drawbacks of Scalping

1. High Transaction Costs

Since scalpers execute many trades in a day, transaction costs can quickly add up. Spread costs, commissions, and fees may eat into the profits made on each trade. It’s important for scalpers to choose brokers that offer tight spreads and low commissions to minimize these costs.

2. Requires Significant Time and Focus

Scalping demands constant attention and quick decision-making. Traders need to be glued to their screens and monitor the market continuously to identify trading opportunities. It can be an intense and time-consuming activity, which might not be suitable for those who prefer a more relaxed trading approach.

3. Leverage Risk

Scalpers often use high leverage to maximize profits from small price changes. While leverage can increase profits, it also amplifies losses. If the market moves against the trader, losses can quickly exceed profits, especially if high leverage is used.

4. Emotional Stress

The fast-paced nature of scalping can lead to emotional stress. The quick entry and exit decisions can create a psychological burden, especially during periods of market uncertainty. Traders need to maintain discipline and not let emotions cloud their judgment, which can be difficult in such a fast-moving environment.

Best Conditions for Scalping

Scalping requires certain market conditions to be effective. Here are a few key factors that make the market ideal for scalping:

1. High Liquidity

Scalpers prefer to trade currency pairs with high liquidity, such as EUR/USD, GBP/USD, and USD/JPY. High liquidity ensures tight spreads and low slippage, both of which are essential for executing quick trades with minimal cost.

2. Low Volatility

While scalping works well in volatile markets, extremely high volatility can increase the risk of unpredictable price movements, making scalping less effective. The ideal market for scalping is one with moderate volatility, where price movements are frequent but not erratic.

3. Low Spread

The spread is the difference between the bid price and ask price. In scalping, where small price movements are targeted, low spreads are essential for profitability. Scalpers should trade with brokers who offer tight spreads to reduce transaction costs.

Tools and Indicators for Scalping

While scalping doesn’t require complex strategies, there are several tools and indicators that can help traders identify profitable opportunities. Some of the most common tools used by scalpers include:

1. Moving Averages

Moving averages, particularly short-term ones like the 5-period and 20-period moving averages, can help identify trends and potential reversals. Scalpers often use these indicators to determine the direction of the market and enter trades accordingly.

2. RSI (Relative Strength Index)

The RSI is a momentum oscillator that helps identify overbought or oversold conditions. Scalpers use RSI to spot potential reversals and find entry points when the market is either overbought or oversold.

3. Bollinger Bands

Bollinger Bands can be useful for scalpers to spot periods of consolidation and volatility. When the price moves outside the bands, it can indicate a potential breakout or reversal, giving scalpers an opportunity to enter or exit trades.

4. MACD (Moving Average Convergence Divergence)

The MACD is another momentum indicator that helps scalpers spot potential trend changes. By looking at MACD crossovers and divergence from price action, traders can identify short-term entry points for scalping.

Risk Management in Forex Trading: Essential Strategies for Success

Forex trading, while offering significant opportunities for profit, also carries a high level of risk. Without proper risk management, traders can quickly find themselves losing substantial amounts of capital. Successful traders understand the importance of managing risk, and they develop strategies to protect themselves from large losses.

In this article, we will explore the significance of risk management in Forex trading, the key strategies used by professional traders, and how you can implement these strategies to improve your trading outcomes.

What is Risk Management in Forex Trading?

Risk management in Forex trading involves identifying, analyzing, and mitigating potential losses in a trading position. The primary goal is to ensure that the potential losses on a trade do not outweigh the potential profits. Effective risk management helps traders avoid emotional decision-making and remain disciplined in their trading approach.

Risk management strategies are essential because, in Forex trading, the market can be volatile, and prices can change rapidly due to various factors such as economic news, geopolitical events, and market sentiment. By implementing risk management techniques, traders can minimize the impact of unexpected market movements.

Why is Risk Management Crucial in Forex Trading?

The high leverage available in Forex trading allows traders to control large positions with a relatively small amount of capital. While leverage can amplify profits, it also magnifies losses. This makes effective risk management even more critical. Without proper risk controls in place, traders are exposed to the possibility of large, uncontrollable losses that could wipe out their accounts.

Moreover, trading psychology plays a significant role in Forex trading. Fear and greed can lead traders to make impulsive decisions that go against their trading plans. By following a disciplined risk management strategy, traders can reduce the emotional stress of trading and focus on making rational decisions based on market conditions.

Key Risk Management Strategies in Forex

1. Setting Stop-Loss Orders

One of the simplest and most effective risk management tools is the stop-loss order. A stop-loss order automatically closes a trade if the price moves against the trader by a specified amount. By using a stop-loss, traders can limit their losses on each trade and prevent emotions from influencing their decisions.

For example, if you enter a buy trade on the EUR/USD pair at 1.2000 and set a stop-loss at 1.1950, the trade will be automatically closed if the price falls to 1.1950, limiting your loss to 50 pips.

Stop-loss orders can also be adjusted as the trade moves in your favor. This is known as a trailing stop. A trailing stop moves the stop-loss level closer to the current market price as the price moves in your favor, locking in profits while protecting you from potential reversals.

2. Proper Position Sizing

Position sizing refers to the amount of capital allocated to each trade. Proper position sizing ensures that you do not risk too much of your trading account on a single trade. The general rule is to risk only a small percentage of your total capital on each trade, typically between 1% and 3%.

For example, if you have a $10,000 trading account and decide to risk 2% per trade, you would risk $200 on each trade. This means that if the trade hits your stop-loss, your loss would be limited to $200, which is within your risk tolerance.

By using proper position sizing, you can protect your capital from large losses and ensure that one bad trade does not significantly affect your overall portfolio.

3. Risk-Reward Ratio

The risk-reward ratio is a critical concept in Forex trading. It refers to the amount of risk you are willing to take on a trade compared to the potential reward. A common risk-reward ratio is 1:2, meaning that for every dollar you risk, you aim to make two dollars in profit.

For example, if your stop-loss is 50 pips, you would target a profit of 100 pips. This ensures that even if you lose more trades than you win, your profitable trades will compensate for the losses.

A good risk-reward ratio helps you make more profit than losses over the long term, even if your win rate is lower than 50%. Traders with a high risk-reward ratio tend to be more successful in the long run.

4. Diversification

Diversification involves spreading your trading risk across multiple currency pairs or asset classes. By not putting all your capital into a single trade or currency pair, you reduce the risk of a significant loss due to an adverse market movement.

For example, instead of trading only the EUR/USD, you could diversify by trading other pairs like GBP/USD, USD/JPY, or even commodities or indices. Diversification can help reduce the overall risk in your trading portfolio and improve the consistency of returns.

5. Use of Leverage Wisely

Leverage allows traders to control a large position with a small amount of capital. While leverage can amplify profits, it can also lead to significant losses if not used carefully. Traders should avoid using excessive leverage, as it increases the potential for large losses.

It’s crucial to use leverage responsibly and ensure that your position size is aligned with your risk management strategy. A common recommendation is to use leverage no higher than 10:1, depending on your risk tolerance and the size of your trading account.

6. Avoiding Overtrading

Overtrading occurs when a trader takes excessive positions, often as a result of greed or the desire to recover losses from previous trades. Overtrading can lead to significant losses and increase the risk of emotional decision-making.

To avoid overtrading, establish a clear trading plan with defined entry and exit points. Stick to your plan and avoid chasing after trades out of fear of missing out (FOMO). Consistency is key to long-term success in Forex trading.

7. Regularly Review and Adjust Your Strategy

The Forex market is constantly changing, and it’s essential to review and adjust your risk management strategy regularly. What works in one market environment may not work in another, so it’s important to remain flexible and adapt to market conditions.

Regularly reviewing your trades and analyzing your performance will help you identify areas for improvement and refine your risk management approach.