Author Archives: admin

Scalping in Forex Trading: Quick Profits in Fast Markets

Forex trading is a dynamic and volatile market, and traders use various strategies to profit from price movements. One of the most popular and exciting strategies is scalping. Scalping in Forex refers to making multiple trades in a short time, aiming to capture small price movements.

In this article, we will dive into what scalping is, how it works, and why it’s becoming a favorite strategy for many Forex traders. We’ll also explore some techniques and the best conditions for scalping, as well as its advantages and potential drawbacks.

What is Scalping in Forex?

Scalping is a strategy that involves making numerous quick trades throughout the day. These trades usually last for a few seconds to a few minutes. The goal of scalping is to capture small price movements that add up over time, accumulating significant profits with many trades.

Scalpers focus on highly liquid currency pairs, such as EUR/USD or GBP/USD, because these pairs offer the small price movements needed for this strategy. Unlike longer-term traders who may hold positions for hours or days, scalpers prefer to get in and out of the market quickly.

How Does Scalping Work?

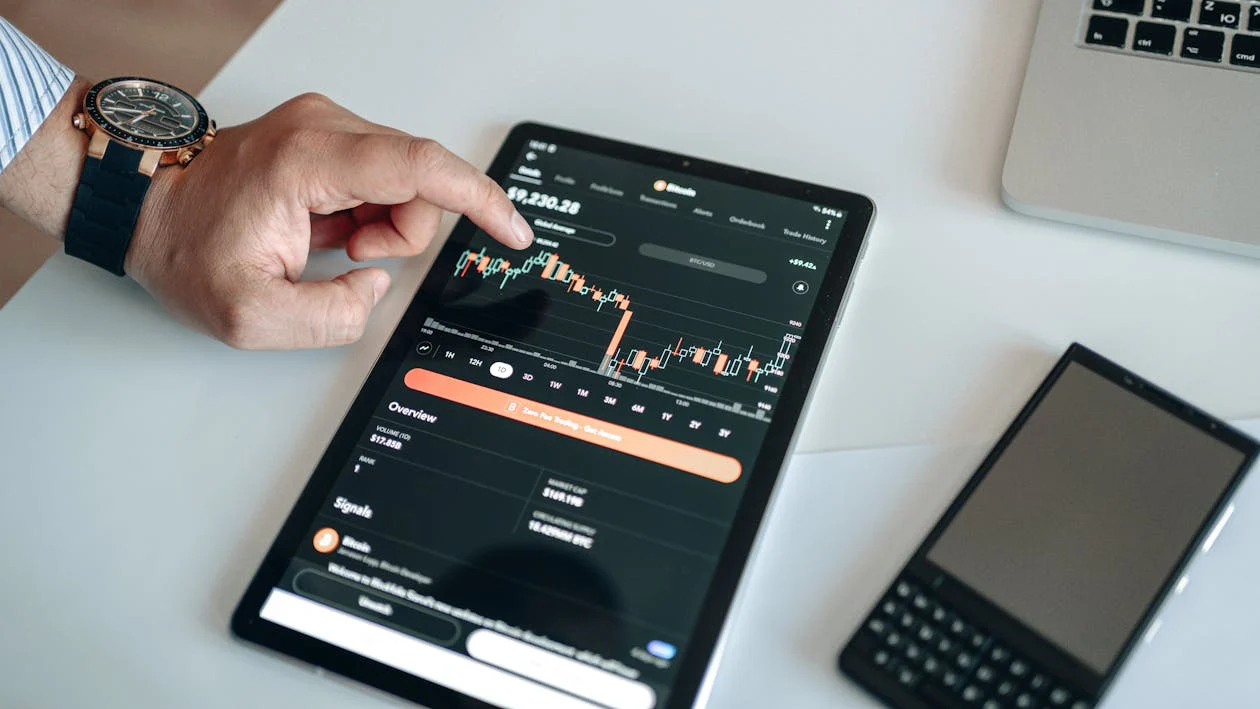
Scalping in Forex is typically done with a very short time frame. Traders who use this strategy monitor charts in real-time to identify opportunities where price movements are small but frequent. The key idea is to execute quick trades based on minute price changes.

To successfully scalp, a trader must:

  • Use tight spreads: Narrow spreads ensure that traders can enter and exit positions quickly without significant slippage.

  • Utilize leverage: Since the profit per trade is small, leverage is often used to magnify gains.

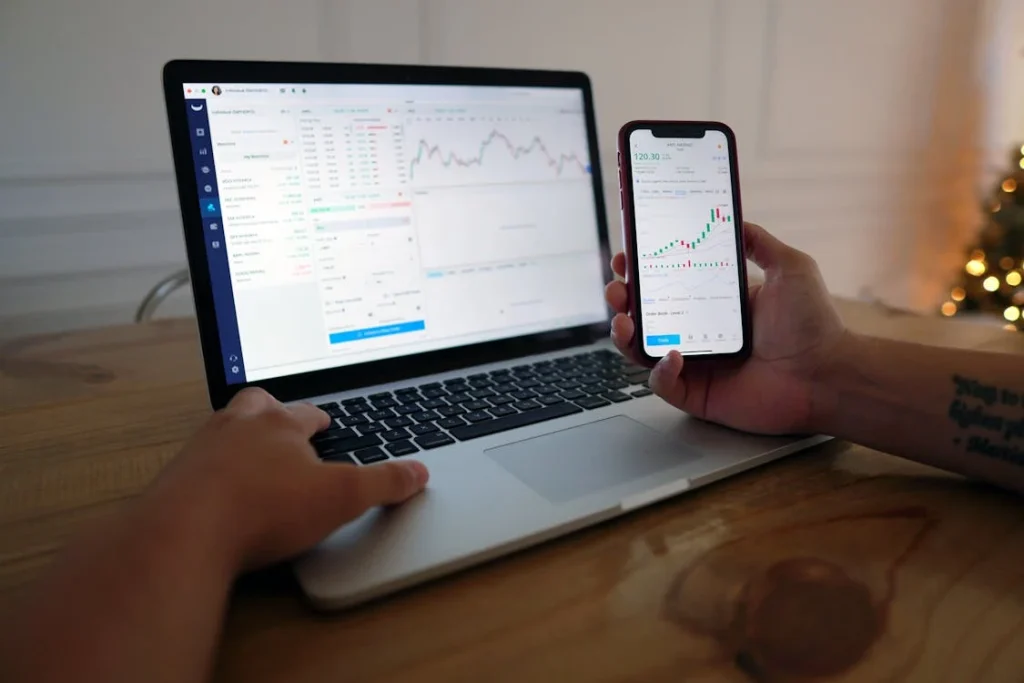
  • Monitor multiple timeframes: Scalpers typically use 1-minute or 5-minute charts to spot quick opportunities.

For example, a scalper might enter a trade on the EUR/USD when they see a 5-pip movement in their favor and exit the trade once they’ve made a small profit of 5 to 10 pips. They then repeat the process several times throughout the day.

Advantages of Scalping

1. Quick Profits

The primary advantage of scalping is the ability to make fast profits. Since scalpers aim for small price movements, they can complete multiple trades in a single day, accumulating small profits that add up over time. This strategy allows for rapid returns, especially in volatile markets.

2. Less Exposure to Market Risk

Scalpers hold their positions for very short periods, often just a few minutes, which means they’re exposed to less market risk compared to longer-term traders. This reduced exposure to the market can be beneficial during times of high volatility when large price swings may occur.

3. Suitable for Volatile Markets

Scalping works best in markets with high volatility. The Forex market is known for its frequent price fluctuations, especially in the most liquid pairs. Scalpers can take advantage of these small fluctuations to generate consistent profits.

4. Low Capital Requirement

Because the goal of scalping is to capture small profits, traders don’t need a large capital base to be successful. The small profits made on each trade can accumulate into meaningful gains without requiring significant capital investment.

Challenges and Drawbacks of Scalping

1. High Transaction Costs

Since scalpers execute many trades in a day, transaction costs can quickly add up. Spread costs, commissions, and fees may eat into the profits made on each trade. It’s important for scalpers to choose brokers that offer tight spreads and low commissions to minimize these costs.

2. Requires Significant Time and Focus

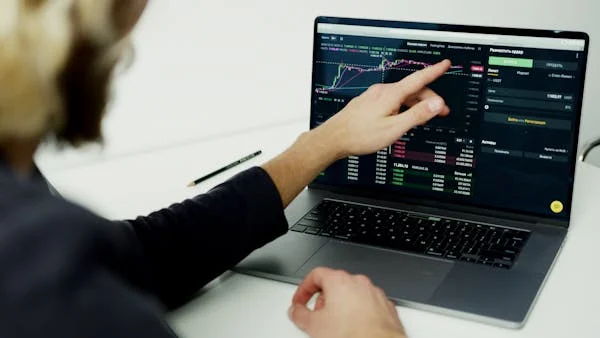
Scalping demands constant attention and quick decision-making. Traders need to be glued to their screens and monitor the market continuously to identify trading opportunities. It can be an intense and time-consuming activity, which might not be suitable for those who prefer a more relaxed trading approach.

3. Leverage Risk

Scalpers often use high leverage to maximize profits from small price changes. While leverage can increase profits, it also amplifies losses. If the market moves against the trader, losses can quickly exceed profits, especially if high leverage is used.

4. Emotional Stress

The fast-paced nature of scalping can lead to emotional stress. The quick entry and exit decisions can create a psychological burden, especially during periods of market uncertainty. Traders need to maintain discipline and not let emotions cloud their judgment, which can be difficult in such a fast-moving environment.

Best Conditions for Scalping

Scalping requires certain market conditions to be effective. Here are a few key factors that make the market ideal for scalping:

1. High Liquidity

Scalpers prefer to trade currency pairs with high liquidity, such as EUR/USD, GBP/USD, and USD/JPY. High liquidity ensures tight spreads and low slippage, both of which are essential for executing quick trades with minimal cost.

2. Low Volatility

While scalping works well in volatile markets, extremely high volatility can increase the risk of unpredictable price movements, making scalping less effective. The ideal market for scalping is one with moderate volatility, where price movements are frequent but not erratic.

3. Low Spread

The spread is the difference between the bid price and ask price. In scalping, where small price movements are targeted, low spreads are essential for profitability. Scalpers should trade with brokers who offer tight spreads to reduce transaction costs.

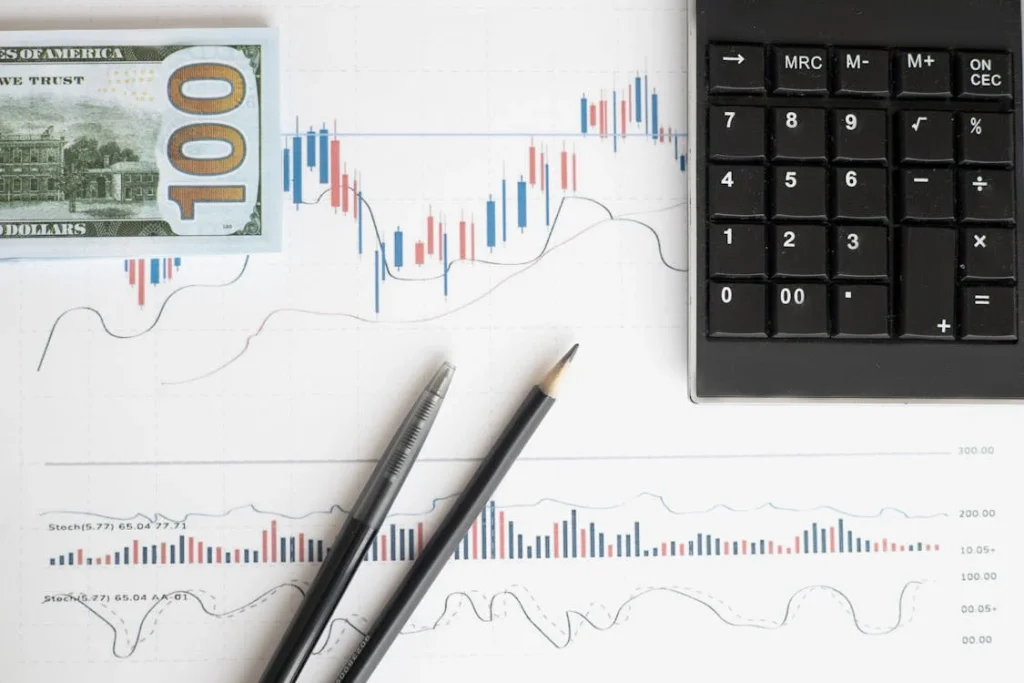
Tools and Indicators for Scalping

While scalping doesn’t require complex strategies, there are several tools and indicators that can help traders identify profitable opportunities. Some of the most common tools used by scalpers include:

1. Moving Averages

Moving averages, particularly short-term ones like the 5-period and 20-period moving averages, can help identify trends and potential reversals. Scalpers often use these indicators to determine the direction of the market and enter trades accordingly.

2. RSI (Relative Strength Index)

The RSI is a momentum oscillator that helps identify overbought or oversold conditions. Scalpers use RSI to spot potential reversals and find entry points when the market is either overbought or oversold.

3. Bollinger Bands

Bollinger Bands can be useful for scalpers to spot periods of consolidation and volatility. When the price moves outside the bands, it can indicate a potential breakout or reversal, giving scalpers an opportunity to enter or exit trades.

4. MACD (Moving Average Convergence Divergence)

The MACD is another momentum indicator that helps scalpers spot potential trend changes. By looking at MACD crossovers and divergence from price action, traders can identify short-term entry points for scalping.

Risk Management in Forex Trading: Essential Strategies for Success

Forex trading, while offering significant opportunities for profit, also carries a high level of risk. Without proper risk management, traders can quickly find themselves losing substantial amounts of capital. Successful traders understand the importance of managing risk, and they develop strategies to protect themselves from large losses.

In this article, we will explore the significance of risk management in Forex trading, the key strategies used by professional traders, and how you can implement these strategies to improve your trading outcomes.

What is Risk Management in Forex Trading?

Risk management in Forex trading involves identifying, analyzing, and mitigating potential losses in a trading position. The primary goal is to ensure that the potential losses on a trade do not outweigh the potential profits. Effective risk management helps traders avoid emotional decision-making and remain disciplined in their trading approach.

Risk management strategies are essential because, in Forex trading, the market can be volatile, and prices can change rapidly due to various factors such as economic news, geopolitical events, and market sentiment. By implementing risk management techniques, traders can minimize the impact of unexpected market movements.

Why is Risk Management Crucial in Forex Trading?

The high leverage available in Forex trading allows traders to control large positions with a relatively small amount of capital. While leverage can amplify profits, it also magnifies losses. This makes effective risk management even more critical. Without proper risk controls in place, traders are exposed to the possibility of large, uncontrollable losses that could wipe out their accounts.

Moreover, trading psychology plays a significant role in Forex trading. Fear and greed can lead traders to make impulsive decisions that go against their trading plans. By following a disciplined risk management strategy, traders can reduce the emotional stress of trading and focus on making rational decisions based on market conditions.

Key Risk Management Strategies in Forex

1. Setting Stop-Loss Orders

One of the simplest and most effective risk management tools is the stop-loss order. A stop-loss order automatically closes a trade if the price moves against the trader by a specified amount. By using a stop-loss, traders can limit their losses on each trade and prevent emotions from influencing their decisions.

For example, if you enter a buy trade on the EUR/USD pair at 1.2000 and set a stop-loss at 1.1950, the trade will be automatically closed if the price falls to 1.1950, limiting your loss to 50 pips.

Stop-loss orders can also be adjusted as the trade moves in your favor. This is known as a trailing stop. A trailing stop moves the stop-loss level closer to the current market price as the price moves in your favor, locking in profits while protecting you from potential reversals.

2. Proper Position Sizing

Position sizing refers to the amount of capital allocated to each trade. Proper position sizing ensures that you do not risk too much of your trading account on a single trade. The general rule is to risk only a small percentage of your total capital on each trade, typically between 1% and 3%.

For example, if you have a $10,000 trading account and decide to risk 2% per trade, you would risk $200 on each trade. This means that if the trade hits your stop-loss, your loss would be limited to $200, which is within your risk tolerance.

By using proper position sizing, you can protect your capital from large losses and ensure that one bad trade does not significantly affect your overall portfolio.

3. Risk-Reward Ratio

The risk-reward ratio is a critical concept in Forex trading. It refers to the amount of risk you are willing to take on a trade compared to the potential reward. A common risk-reward ratio is 1:2, meaning that for every dollar you risk, you aim to make two dollars in profit.

For example, if your stop-loss is 50 pips, you would target a profit of 100 pips. This ensures that even if you lose more trades than you win, your profitable trades will compensate for the losses.

A good risk-reward ratio helps you make more profit than losses over the long term, even if your win rate is lower than 50%. Traders with a high risk-reward ratio tend to be more successful in the long run.

4. Diversification

Diversification involves spreading your trading risk across multiple currency pairs or asset classes. By not putting all your capital into a single trade or currency pair, you reduce the risk of a significant loss due to an adverse market movement.

For example, instead of trading only the EUR/USD, you could diversify by trading other pairs like GBP/USD, USD/JPY, or even commodities or indices. Diversification can help reduce the overall risk in your trading portfolio and improve the consistency of returns.

5. Use of Leverage Wisely

Leverage allows traders to control a large position with a small amount of capital. While leverage can amplify profits, it can also lead to significant losses if not used carefully. Traders should avoid using excessive leverage, as it increases the potential for large losses.

It’s crucial to use leverage responsibly and ensure that your position size is aligned with your risk management strategy. A common recommendation is to use leverage no higher than 10:1, depending on your risk tolerance and the size of your trading account.

6. Avoiding Overtrading

Overtrading occurs when a trader takes excessive positions, often as a result of greed or the desire to recover losses from previous trades. Overtrading can lead to significant losses and increase the risk of emotional decision-making.

To avoid overtrading, establish a clear trading plan with defined entry and exit points. Stick to your plan and avoid chasing after trades out of fear of missing out (FOMO). Consistency is key to long-term success in Forex trading.

7. Regularly Review and Adjust Your Strategy

The Forex market is constantly changing, and it’s essential to review and adjust your risk management strategy regularly. What works in one market environment may not work in another, so it’s important to remain flexible and adapt to market conditions.

Regularly reviewing your trades and analyzing your performance will help you identify areas for improvement and refine your risk management approach.

The Importance of Fundamental Analysis in Forex Trading

In the dynamic and fast-paced world of Forex trading, it is crucial for traders to have a well-rounded understanding of the factors influencing currency markets. While many traders rely heavily on technical analysis, which focuses on past price movements, fundamental analysis provides a deeper insight into the broader economic, political, and social factors that affect currency values.

In this article, we will explore what fundamental analysis is, why it’s important in Forex trading, and how you can use it to make better-informed trading decisions.

What is Fundamental Analysis?

Fundamental analysis is the study of economic, financial, and geopolitical factors that influence the value of a currency. This method examines various economic indicators, political events, central bank policies, and geopolitical developments to assess the overall strength or weakness of a currency.

Unlike technical analysis, which focuses on past price data, fundamental analysis looks at the underlying economic and political conditions that drive currency prices.

Why is Fundamental Analysis Important in Forex Trading?

Fundamental analysis is important in Forex trading because it helps traders understand the big picture and gain insight into the forces that drive currency price movements. Unlike technical analysis, which is based purely on historical data, fundamental analysis takes into account factors like:

  • Interest rates set by central banks.

  • Inflation rates and their impact on purchasing power.

  • Economic growth and GDP data.

  • Unemployment rates and labor market conditions.

  • Political stability and government policies.

  • Global trade and capital flows.

By understanding these factors, traders can better predict long-term currency trends and make more informed decisions about when to buy or sell a particular currency.

Key Economic Indicators in Fundamental Analysis

Several economic indicators are essential when conducting fundamental analysis in Forex trading. These indicators provide valuable data that helps traders gauge the health of an economy and predict currency movements.

1. Interest Rates

Interest rates set by central banks, such as the Federal Reserve in the United States or the European Central Bank (ECB), have a significant impact on currency values. Higher interest rates tend to attract foreign investment, increasing demand for the currency and causing its value to rise.

Conversely, lower interest rates can have the opposite effect, leading to a depreciation in the currency’s value. Traders often closely monitor central bank meetings and interest rate announcements to gauge the direction of currency movements.

2. GDP (Gross Domestic Product)

GDP is the total value of goods and services produced by a country and is often used as an indicator of economic health. A growing GDP suggests a healthy and expanding economy, which can lead to a stronger currency. On the other hand, a shrinking GDP or economic contraction can result in currency weakness.

Traders use GDP data to assess the strength of a country’s economy and predict whether the central bank may change its monetary policy in response to economic growth or decline.

3. Inflation Rates

Inflation refers to the rate at which the prices of goods and services rise over time. Moderate inflation is generally considered a sign of a healthy economy, but high inflation can erode the value of a currency and reduce purchasing power.

Central banks often adjust interest rates in response to inflation to maintain price stability. High inflation typically leads to higher interest rates, which can strengthen the currency. Traders pay close attention to inflation data, such as the Consumer Price Index (CPI), to assess the potential impact on currency values.

4. Unemployment Rate

The unemployment rate is a key indicator of economic health. A high unemployment rate signals a weak economy, which can lead to lower consumer spending and reduced demand for a country’s currency. Conversely, a low unemployment rate suggests a strong economy with healthy labor market conditions.

Traders look at the unemployment rate to gauge the strength of the labor market and assess the potential for future economic growth.

5. Retail Sales and Consumer Confidence

Retail sales data provides insight into consumer spending, which is a key driver of economic growth. Strong retail sales suggest that consumers are confident and willing to spend, which can boost economic growth and support currency strength.

Similarly, consumer confidence indicators, such as the Consumer Confidence Index (CCI), provide insight into how optimistic consumers feel about the economy. High consumer confidence can lead to increased spending and stronger economic performance, potentially strengthening the currency.

6. Trade Balance

The trade balance measures the difference between a country’s exports and imports. A trade surplus, where exports exceed imports, typically strengthens the currency, as it indicates strong demand for the country’s goods and services.

A trade deficit, where imports exceed exports, can weaken the currency, as it suggests that the country is importing more than it is exporting, potentially leading to higher demand for foreign currencies.

7. Political Stability and Economic Policy

Political events, such as elections, government stability, and policy changes, can have a profound effect on currency values. Political instability or uncertain government policies can lead to a loss of confidence in a country’s economy, causing its currency to depreciate.

Traders pay close attention to elections, government decisions, and geopolitical tensions, as these can cause significant volatility in the Forex market.

How to Use Fundamental Analysis in Forex Trading

To use fundamental analysis effectively in Forex trading, traders need to combine it with technical analysis and develop a comprehensive trading strategy. Here’s how you can use fundamental analysis:

1. Monitor Key Economic Reports

Keep an eye on economic calendars to track upcoming economic reports and events, such as interest rate decisions, GDP data, inflation reports, and employment figures. These reports provide valuable information about the health of the economy and can influence currency movements.

2. Stay Updated on Central Bank Policies

Central banks play a crucial role in currency values through their monetary policies. Regularly follow central bank announcements and speeches to understand the outlook for interest rates and other economic measures. This can help you predict potential currency movements.

3. Combine Fundamental and Technical Analysis

While fundamental analysis provides valuable insights into long-term trends, technical analysis can help identify short-term trading opportunities. Combining both methods allows you to make more informed and balanced trading decisions.

4. Understand Market Sentiment

Market sentiment refers to the overall mood of traders and investors, influenced by factors such as economic data, geopolitical events, and global trade. Understanding market sentiment can help you gauge whether a currency is overbought or oversold and predict potential reversals.

Technical Analysis in Forex Trading: Mastering the Art of Chart Analysis

Technical analysis is one of the most popular methods used by traders in the Forex market. It involves analyzing historical price data to forecast future price movements. By studying charts, patterns, and technical indicators, traders can make informed decisions about when to enter or exit the market.

In this article, we will explore what technical analysis is, why it’s so important in Forex trading, and some key techniques you can use to improve your trading strategy.

What is Technical Analysis?

Technical analysis is a method of evaluating financial markets by analyzing past market data, primarily price and volume. Unlike fundamental analysis, which looks at the economic and financial factors influencing a market, technical analysis focuses on price movements and patterns to predict future market behavior.

Technical analysts believe that all relevant information is already reflected in the price of an asset, and by studying charts, traders can identify patterns and trends that suggest where the price might move next.

Why is Technical Analysis Important in Forex Trading?

Forex markets are highly dynamic and can change rapidly due to various economic, political, and social events. Technical analysis allows traders to:

  • Identify trends: By recognizing the direction in which a currency pair is moving, traders can make decisions that align with the market trend.

  • Predict potential price movements: Using past price data, traders can forecast where the price is likely to go next, helping them make profitable trades.

  • Determine entry and exit points: Technical analysis helps traders identify optimal entry and exit levels, enhancing their trade execution.

While fundamental analysis is important for understanding the underlying factors affecting a currency, technical analysis is more commonly used for short-term trading and offers a more straightforward way of making trading decisions based on price action.

Key Components of Technical Analysis

1. Price Charts

The price chart is the foundation of technical analysis. It displays historical price movements over a specific period and is used to identify trends, patterns, and key levels of support and resistance.

Types of Price Charts:

  • Line Chart: A simple chart showing the closing prices over a period. It’s useful for identifying overall trends.

  • Bar Chart: A more detailed chart that displays the open, high, low, and close prices for each time period.

  • Candlestick Chart: A popular chart used by traders that shows the open, high, low, and close prices, with each “candlestick” representing a specific time period.

Candlestick charts provide a more detailed view of price action and help traders identify bullish and bearish trends.

2. Support and Resistance Levels

Support and resistance are critical concepts in technical analysis. These levels represent price points where the market has historically reversed its direction.

  • Support: A price level where a currency pair tends to stop falling and starts to rise again. It’s like a floor that prevents the price from dropping further.

  • Resistance: A price level where a currency pair tends to stop rising and starts to fall again. It acts like a ceiling that prevents the price from going higher.

By identifying support and resistance levels, traders can make informed decisions about when to enter or exit a trade, as these levels often act as barriers that can influence price movement.

3. Trendlines and Channels

Trendlines are used to identify the direction of the market. A trendline is drawn by connecting two or more significant price points, such as the highs or lows of a price movement.

  • Uptrend: A series of higher highs and higher lows. An uptrend line is drawn below the lows of the price to show the general direction.

  • Downtrend: A series of lower highs and lower lows. A downtrend line is drawn above the highs of the price to show the downward direction.

Channels are parallel lines drawn above and below a trendline to show the range within which the price moves. Channels help traders identify when the price is overbought or oversold and can signal potential reversals.

4. Technical Indicators

Technical indicators are mathematical calculations based on the price and volume of a currency pair. They are used to confirm trends, identify overbought or oversold conditions, and help forecast future price movements. Some of the most commonly used indicators include:

Moving Averages (MA)

A moving average smooths out price data to identify the direction of the trend. The most common types of moving averages are:

  • Simple Moving Average (SMA): The average price over a specific number of periods.

  • Exponential Moving Average (EMA): Similar to the SMA but gives more weight to recent prices.

Relative Strength Index (RSI)

The RSI is a momentum oscillator that measures the speed and change of price movements. It ranges from 0 to 100, with values above 70 indicating an overbought condition and values below 30 indicating an oversold condition.

Moving Average Convergence Divergence (MACD)

The MACD is a trend-following momentum indicator that shows the relationship between two moving averages (typically the 12-day and 26-day EMAs). It helps identify potential buy and sell signals based on crossovers.

Bollinger Bands

Bollinger Bands consist of three lines: a moving average (usually the 20-period SMA), and two standard deviation lines that represent the upper and lower limits of price movement. When the price moves outside of the bands, it may signal overbought or oversold conditions.

5. Chart Patterns

Chart patterns are visual formations created by price movements that help traders predict future price action. These patterns are typically categorized into two types: continuation patterns and reversal patterns.

  • Continuation Patterns: Indicate that the price is likely to continue in the same direction after a brief consolidation. Examples include triangles, flags, and pennants.

  • Reversal Patterns: Indicate that the price is likely to change direction. Examples include head and shoulders, double tops, and double bottoms.

By identifying chart patterns, traders can anticipate price movements and position themselves accordingly.

How to Use Technical Analysis Effectively

To use technical analysis effectively in Forex trading, traders need to combine several techniques and tools. It’s important to:

  1. Identify the trend: Start by determining whether the market is in an uptrend, downtrend, or range-bound. This will help you decide whether to buy or sell.

  2. Look for confirmation: Use technical indicators and chart patterns to confirm the direction of the trend and determine the best entry and exit points.

  3. Manage risk: Always use proper risk management techniques, such as stop-loss orders and position sizing, to protect your capital.

  4. Practice patience: Technical analysis is not about predicting every price movement but rather about identifying high-probability setups. Patience and discipline are key to success.

Risk Management in Forex Trading: Key Techniques for Protecting Your Capital

Forex trading offers incredible opportunities for profit, but it also comes with significant risks. Managing these risks is essential to ensuring long-term success in the Forex market. In fact, many successful traders attribute their success not to how much they earn, but to how well they manage risk.

In this article, we will explore some of the key techniques and strategies for managing risk in Forex trading. By incorporating these techniques into your trading plan, you can protect your capital and increase your chances of success.

Why is Risk Management Important in Forex Trading?

Risk management is a critical aspect of trading because the Forex market can be unpredictable. Currencies are affected by a wide range of factors, including economic data, political events, geopolitical tensions, and market sentiment. These factors can cause sudden and significant price movements, which could lead to substantial losses if not properly managed.

Good risk management helps traders minimize their potential losses while maximizing their opportunities for profit. It also helps prevent emotional trading decisions that can arise from the fear of losing money, leading to more rational and disciplined actions.

Key Risk Management Techniques

1. Setting Stop-Loss Orders

A stop-loss order is one of the most important tools in a trader’s risk management arsenal. It is an order placed with a broker to automatically close a trade when the price reaches a specific level, thereby limiting potential losses.

How it Works:

  • Before entering a trade, the trader sets a stop-loss at a predetermined price level.

  • If the market moves against the trade and hits the stop-loss level, the position is closed automatically, preventing further losses.

  • Stop-loss orders can be placed based on technical levels, such as support and resistance, or as a percentage of the total position size.

Benefits:

  • Limit losses: Helps prevent large, unexpected losses.

  • Automatic execution: Ensures that losses are limited without requiring constant monitoring of the market.

  • Discipline: Stops traders from holding onto losing positions in the hope that the market will reverse.

2. Position Sizing

Position sizing refers to determining how much of your trading capital to risk on a single trade. By adjusting position sizes based on risk tolerance, you can ensure that no single trade threatens a significant portion of your capital.

How it Works:

  • Traders use a fixed percentage of their capital to risk on each trade, typically between 1-2% of their total capital.

  • For example, if a trader has a $10,000 trading account and decides to risk 1% per trade, the maximum loss per trade would be $100.

  • The position size can be calculated based on the distance between the entry point and the stop-loss level.

Benefits:

  • Capital protection: Limits the amount of money you risk on each trade, reducing the likelihood of losing your entire account balance.

  • Consistency: By keeping the risk level constant, traders can manage losses and maintain consistency over time.

3. Risk-Reward Ratio

The risk-reward ratio is a critical aspect of Forex risk management that helps traders assess the potential profitability of a trade relative to the risk they are taking. A favorable risk-reward ratio helps ensure that the potential gains outweigh the potential losses.

How it Works:

  • The risk-reward ratio is calculated by dividing the potential risk of a trade by the potential reward. For example, if a trader is risking $100 to make $300, the risk-reward ratio would be 1:3.

  • A common recommendation is to aim for a minimum risk-reward ratio of 1:2 or higher, meaning the trader is looking to gain at least twice the amount they are willing to risk.

Benefits:

  • Balanced approach: Ensures that the potential reward justifies the risk involved.

  • Long-term profitability: Even with a lower win rate, a positive risk-reward ratio can help traders remain profitable over time.

4. Diversification

Diversification in Forex trading refers to spreading risk across different currency pairs, rather than focusing all trades on a single pair. By diversifying, traders reduce the potential impact of a negative movement in one currency pair on their overall portfolio.

How it Works:

  • Traders can diversify by trading different currency pairs from various regions, such as EUR/USD, GBP/JPY, and AUD/CHF.

  • Diversification can also be achieved by combining different trading strategies, such as swing trading and day trading, to spread risk across different timeframes.

Benefits:

  • Reduced risk: Reduces the impact of adverse movements in a single currency pair.

  • Increased opportunities: By monitoring multiple currency pairs, traders may find more profitable opportunities.

5. Use of Leverage Wisely

Leverage is a powerful tool that allows traders to control a larger position with a smaller amount of capital. While leverage can amplify profits, it also increases the potential for significant losses. It is essential for traders to use leverage cautiously.

How it Works:

  • Leverage is typically expressed as a ratio, such as 50:1 or 100:1, which means the trader can control a position 50 or 100 times larger than their actual capital.

  • Traders should carefully choose the amount of leverage they use, ensuring that it aligns with their risk tolerance and capital.

Benefits:

  • Increased profitability: Leverage allows traders to maximize potential profits.

  • Lower capital requirements: Traders can open larger positions with a smaller amount of capital.

Risks:

  • Amplified losses: While leverage increases profit potential, it also magnifies losses. If the market moves against a leveraged position, losses can exceed the initial investment.

  • Margin calls: If losses exceed a certain threshold, traders may receive a margin call, requiring them to add more funds to their account to maintain the position.

6. Avoid Overtrading

Overtrading is one of the most common mistakes that lead to significant losses in Forex trading. It occurs when traders take too many trades, often in response to emotional impulses like fear of missing out (FOMO) or greed.

How it Works:

  • Overtrading can lead to excessive exposure in the market, which increases the chances of losses.

  • Traders should avoid entering trades out of boredom or emotion and instead focus on high-quality setups based on their strategy.

Benefits:

  • Prevents excessive risk: By limiting the number of trades, traders can maintain better control over their overall risk exposure.

  • Promotes discipline: Avoiding overtrading helps traders stick to their trading plan and reduces emotional decision-making.

Forex Trading Strategies: How to Approach the Market for Maximum Profit

Forex trading is a fast-paced, dynamic, and potentially lucrative market that attracts traders from all over the world. However, to succeed in the Forex market, you need more than just the desire to trade – you need a solid strategy. In this article, we’ll explore the different Forex trading strategies and how to choose the right one for your trading style and risk tolerance.

What is a Forex Trading Strategy?

A Forex trading strategy is a set of rules or guidelines that traders follow to make decisions in the market. A trading strategy may involve specific entry and exit points, risk management techniques, and trade size considerations. The goal of any strategy is to increase the chances of success in the Forex market by providing a systematic and disciplined approach to trading.

Different strategies can be used depending on a trader’s risk appetite, trading style, and market conditions. Some traders prefer short-term strategies, while others may use long-term approaches. Let’s dive into some of the most popular Forex trading strategies used by successful traders.

Popular Forex Trading Strategies

1. Trend Following Strategy

The trend following strategy is based on the idea that markets tend to move in trends—either upward (bullish), downward (bearish), or sideways (neutral). This strategy involves identifying the current market trend and trading in the direction of that trend.

How it Works:

  • Traders use technical indicators like moving averages or trendlines to identify the direction of the market.

  • Once a trend is identified, traders open a position in the same direction. For example, if the market is in an uptrend, the trader will open a long (buy) position.

  • The position is kept open as long as the trend continues, and the trader may use trailing stops to lock in profits as the market moves in their favor.

Pros:

  • Can be very profitable when a strong trend is in place.

  • Simple to understand and easy to execute for beginners.

Cons:

  • This strategy requires patience, as trends may take time to develop.

  • False signals can occur during sideways or range-bound market conditions.

2. Scalping Strategy

Scalping is a short-term trading strategy that focuses on making small profits from small price movements. The aim is to capitalize on tiny fluctuations in price, often holding trades for just a few minutes.

How it Works:

  • Traders look for highly liquid currency pairs with tight spreads.

  • They open and close positions quickly, aiming to make small profits per trade. Typically, traders may aim for profits of 5-10 pips per trade.

  • Scalpers use tools such as 1-minute charts or 5-minute charts to make fast decisions.

Pros:

  • Can generate many small profits, adding up over time.

  • Suitable for traders who prefer high-frequency trading and fast decision-making.

Cons:

  • Requires a lot of focus and attention, as trades need to be executed quickly.

  • Transaction costs (spreads and commissions) can accumulate and eat into profits.

3. Swing Trading Strategy

Swing trading is a medium-term trading strategy that involves capturing price “swings” or trends over several days to weeks. Swing traders aim to enter the market when a currency pair is experiencing a short-term pullback or correction within a longer-term trend.

How it Works:

  • Traders use a mix of technical analysis and fundamental analysis to identify currency pairs with strong potential for short-term price movement.

  • They aim to buy low and sell high or sell high and buy low during price swings.

  • Trades are typically held for several days or weeks, depending on the market conditions.

Pros:

  • Offers a balance between long-term and short-term trading strategies.

  • Does not require constant monitoring of the market like scalping.

Cons:

  • May require patience, as price swings can take time to develop.

  • Risk of overnight market gaps, where price may change significantly between the close of one trading day and the opening of the next.

4. Range Trading Strategy

The range trading strategy is used in markets that are not trending but are instead moving sideways within a defined range. Traders using this strategy buy at support levels and sell at resistance levels, anticipating that prices will continue to move within the established range.

How it Works:

  • Traders identify support and resistance levels using technical analysis tools such as horizontal lines, trendlines, or Fibonacci retracements.

  • When the market reaches a support level, traders buy, and when it reaches a resistance level, they sell.

  • The strategy assumes that the market will remain within the range and not break out.

Pros:

  • Ideal for range-bound or sideways markets.

  • Can be profitable when the market is moving within a predictable range.

Cons:

  • The strategy can fail if the market breaks out of the range, leading to significant losses.

  • It may not work well in trending markets.

5. Carry Trading Strategy

Carry trading involves borrowing funds in a low-interest-rate currency and investing in a currency with a higher interest rate. The goal is to profit from the difference in interest rates between the two currencies, known as the interest rate differential.

How it Works:

  • Traders look for currency pairs with a wide interest rate differential.

  • They open a position in the higher-yielding currency, earning interest while holding the position.

  • Carry traders typically hold their positions for weeks or months, earning interest on the trade while also benefiting from potential currency appreciation.

Pros:

  • Can generate passive income from interest rate differentials.

  • Suitable for long-term traders.

Cons:

  • Exposed to the risk of currency depreciation, which could offset interest gains.

  • Requires patience and the ability to manage long-term positions.

How to Choose the Right Strategy

When selecting a Forex trading strategy, it’s important to consider your trading style, risk tolerance, and time commitment:

  • Scalping is best for traders who can dedicate significant time and attention to short-term trades.

  • Swing trading suits those who want to capture larger price moves over a few days or weeks.

  • Range trading works well in sideways markets and can be a more relaxed approach for traders.

  • Carry trading is ideal for those looking for long-term investment opportunities and passive income.

Additionally, remember to incorporate risk management techniques, such as using stop-loss orders, managing position sizes, and setting realistic profit targets.

Fundamental Analysis in Forex Trading: A Comprehensive Guide

Fundamental analysis is one of the key approaches traders use to analyze the Forex market. Unlike technical analysis, which focuses on price patterns and historical data, fundamental analysis looks at the broader economic, financial, and political factors that influence currency prices. Understanding these factors allows traders to anticipate market movements and make informed decisions.

In this article, we’ll explore the basics of fundamental analysis, key indicators to watch, and how you can use this method in Forex trading to improve your trading strategy.

What is Fundamental Analysis?

Fundamental analysis is the study of economic and political events and data to understand how they might influence a currency’s value. Traders use this approach to assess the overall health of an economy and its impact on the currency market. By analyzing data like interest rates, GDP, inflation, and employment figures, traders aim to predict currency movements based on economic trends and events.

The goal of fundamental analysis is to identify whether a currency is undervalued or overvalued relative to its fundamental value. This approach requires a deep understanding of the factors that drive currency movements.

Key Economic Indicators in Fundamental Analysis

1. Interest Rates

Interest rates are one of the most important indicators in fundamental analysis. Central banks, such as the Federal Reserve in the United States, the European Central Bank (ECB), and the Bank of England (BoE), use interest rates to control monetary policy and influence economic conditions.

Higher interest rates generally lead to a stronger currency because they attract foreign capital, as investors seek higher returns on investments. Conversely, lower interest rates tend to weaken the currency, as capital flows out in search of better returns elsewhere.

Traders closely monitor central bank meetings and statements regarding interest rate changes and adjust their positions accordingly.

2. GDP (Gross Domestic Product)

Gross Domestic Product (GDP) is the total value of all goods and services produced within a country over a specific period. GDP is one of the most widely used indicators to measure the strength of an economy.

A growing GDP typically signals a strong economy, which can support a stronger currency. On the other hand, a contracting GDP can indicate economic trouble and may lead to a weaker currency.

Forex traders closely follow GDP data to assess the economic health of a country and make informed predictions about currency movements.

3. Inflation Rates

Inflation refers to the rate at which prices for goods and services increase over time. Central banks typically target a specific inflation rate to ensure the economy remains stable. High inflation can erode purchasing power, leading to a decrease in the value of a currency.

In Forex trading, traders look for countries with stable inflation rates, as low and stable inflation typically supports currency strength. On the other hand, countries with high or volatile inflation may see their currencies weaken as the central bank may lower interest rates to combat inflation.

4. Employment Data

Employment data, particularly the Non-Farm Payroll (NFP) report in the United States, is a critical indicator of economic health. High employment levels generally indicate a strong economy, as people are earning and spending money, which drives economic growth.

Conversely, high unemployment can signal economic weakness and can lead to a weaker currency. Traders often pay close attention to employment reports to gauge the strength of an economy and predict potential market movements.

5. Trade Balance and Current Account

The trade balance measures the difference between a country’s exports and imports. A country with a trade surplus exports more than it imports, which can lead to a stronger currency as demand for the country’s goods and services increases.

A trade deficit, on the other hand, means a country imports more than it exports, leading to a weaker currency. Forex traders use trade balance data to assess the overall health of an economy and predict potential currency movements.

6. Political Stability and Geopolitical Events

Political events, such as elections, government changes, and geopolitical instability, can significantly impact currency prices. A stable government and a favorable political environment can boost investor confidence and strengthen the currency.

However, political instability or geopolitical tensions (such as trade wars or military conflicts) can create uncertainty in the markets and lead to a weaker currency. Traders must stay informed about current events and political developments to understand their potential impact on currency prices.

How to Use Fundamental Analysis in Forex Trading

1. Monitor Economic Calendars

Forex traders should stay informed about upcoming economic reports and events that can affect currency prices. Economic calendars provide a schedule of data releases, including GDP reports, employment data, inflation reports, and central bank meetings.

By monitoring these events, traders can anticipate potential market movements and plan their trades accordingly. For example, a trader might choose to avoid trading during important data releases, or they might take advantage of volatility after a major economic report is released.

2. Assess Economic Health

When analyzing a currency pair, it’s essential to assess the economic health of both countries involved. Traders often compare key economic indicators such as GDP growth, inflation, and unemployment in each country to determine which currency has a stronger economic outlook.

For example, if the U.S. economy is growing faster than the Eurozone economy, and inflation is under control, the U.S. dollar may strengthen relative to the euro.

3. Understand Central Bank Policies

Central banks play a crucial role in determining the direction of a currency. By studying central bank policies and their economic outlook, traders can gain insight into potential interest rate changes and the future direction of the currency.

For example, if the Federal Reserve is expected to raise interest rates while the European Central Bank is expected to keep rates unchanged, the U.S. dollar may strengthen against the euro.

4. Analyze Market Sentiment

Market sentiment refers to the overall attitude of investors toward a particular currency or market. Traders can gauge market sentiment by studying economic reports, political events, and global news. Positive sentiment can lead to currency appreciation, while negative sentiment can lead to currency depreciation.

By understanding market sentiment, traders can make more informed decisions about when to enter or exit trades.

Advantages of Fundamental Analysis

  • Long-Term Focus: Fundamental analysis is best suited for traders who have a long-term outlook. It helps identify trends and potential long-term movements in the Forex market.

  • Global Perspective: Fundamental analysis provides a broad understanding of global economic conditions and how they affect currency prices.

  • Informed Decision-Making: By analyzing economic data and political events, traders can make more informed decisions and anticipate market movements with greater accuracy.

Technical Analysis in the Forex Market: A Beginner’s Guide

Technical analysis is one of the most popular methods used by Forex traders to predict price movements and make informed trading decisions. Unlike fundamental analysis, which looks at the economic factors influencing currency prices, technical analysis focuses on historical price data and chart patterns to forecast future trends. In this article, we will explore the basics of technical analysis and how it can be applied in Forex trading.

What is Technical Analysis?

Technical analysis involves analyzing price charts, market data, and indicators to identify trends and patterns that can predict future price movements. The idea behind technical analysis is that price movements are not random, and they follow predictable patterns over time due to the behavior of market participants.

The primary tools used in technical analysis are charts, indicators, and oscillators. Traders use these tools to look for patterns, trends, and signals that can guide their trading decisions.

Key Components of Technical Analysis

1. Price Charts

The foundation of technical analysis is the price chart. Price charts display the historical movement of a currency pair over a specific period. The three most common types of charts used in technical analysis are:

  • Line Chart: The simplest form of a chart, showing a line that connects the closing prices of a currency pair over time.

  • Bar Chart: A more detailed chart showing the opening, closing, high, and low prices for each time period.

  • Candlestick Chart: A popular chart type that provides more information than bar charts. Each candlestick represents a specific time period and shows the open, close, high, and low prices. Candlestick charts are favored for their ability to display price action clearly.

2. Trendlines and Support/Resistance Levels

One of the first steps in technical analysis is identifying trends. Trends refer to the general direction of the market: up, down, or sideways. Traders use trendlines to mark the direction of the trend and determine entry and exit points.

  • Support levels are price points where a currency pair tends to stop falling and may start rising again. Support acts like a floor for prices.

  • Resistance levels are price points where a currency pair tends to stop rising and may reverse direction. Resistance acts like a ceiling for prices.

3. Moving Averages

A moving average is a technical indicator that smooths out price data by creating a constantly updated average price. The two most common types of moving averages are:

  • Simple Moving Average (SMA): The average of prices over a specific number of periods.

  • Exponential Moving Average (EMA): Gives more weight to recent prices, making it more responsive to recent price movements.

Moving averages help traders identify the overall direction of a trend and can act as support or resistance levels.

4. Oscillators and Indicators

Oscillators are tools used to identify overbought or oversold conditions in the market. The most common oscillators used in Forex trading are:

  • Relative Strength Index (RSI): A momentum oscillator that measures the speed and change of price movements. It ranges from 0 to 100, with readings above 70 indicating overbought conditions and readings below 30 indicating oversold conditions.

  • Moving Average Convergence Divergence (MACD): A trend-following momentum indicator that shows the relationship between two moving averages of a currency’s price. It is used to identify changes in the strength, direction, and duration of a trend.

Other important indicators include the Bollinger Bands, Stochastic Oscillator, and Fibonacci retracement levels.

How to Use Technical Analysis in Forex Trading

1. Identifying Trends

The first step in using technical analysis is identifying the market trend. If the market is trending upward, it is a bullish trend, and if it is moving downward, it is a bearish trend. A sideways market indicates a lack of trend or range-bound market.

Traders should use tools like trendlines and moving averages to help identify the trend and trade in the direction of that trend.

2. Recognizing Chart Patterns

Chart patterns are formations created by the price movements of a currency pair. Some of the most common chart patterns are:

  • Head and Shoulders: A reversal pattern that signals the end of an uptrend and the beginning of a downtrend.

  • Double Top/Double Bottom: Reversal patterns indicating a price level that will likely not be surpassed.

  • Triangles: Continuation patterns that indicate the price is likely to continue moving in the same direction after a period of consolidation.

Recognizing these patterns early can help traders make informed decisions about when to enter or exit a trade.

3. Using Indicators for Confirmation

Indicators can help traders confirm their trade signals and enhance their analysis. For example, if a bullish candlestick pattern forms at a support level, traders may use the RSI to confirm that the currency is not yet overbought. Similarly, a MACD crossover can confirm the strength of a trend.

4. Setting Stop-Loss and Take-Profit Orders

One of the key aspects of risk management is the use of stop-loss orders to limit potential losses. A take-profit order is used to lock in profits at a predefined price level.

Traders use support and resistance levels to set their stop-loss and take-profit orders. For example, if entering a long position at support, a trader may place a stop-loss just below the support level to limit risk.

Advantages of Technical Analysis in Forex Trading

  • Visual Tools: Price charts and indicators make it easier for traders to spot trends and patterns.

  • Objective Decision-Making: By relying on historical price data and indicators, traders can make decisions based on facts rather than emotions.

  • Versatility: Technical analysis can be applied to any currency pair and works on different timeframes, from short-term scalping to long-term trading.

Economic Factors That Affect the Forex Market: A Comprehensive Overview

The Forex market is influenced by a wide range of factors, but none are more significant than economic factors. Understanding how economic events, indicators, and trends impact the currency markets is crucial for successful trading. In this article, we’ll explore some of the key economic factors that can influence currency values and provide insights into how traders can use this information to make better decisions.

1. Interest Rates and Central Bank Policies

Interest rates are one of the most powerful drivers of currency values. Central banks, such as the Federal Reserve (Fed) in the United States, the European Central Bank (ECB), and the Bank of England (BoE), set interest rates as part of their monetary policy. These rates directly impact the value of a country’s currency.

How Interest Rates Affect the Forex Market:

  • Higher interest rates tend to increase the value of a currency because they offer higher returns on investments in that currency. As a result, foreign capital flows into that country, increasing demand for its currency.

  • Lower interest rates tend to weaken the currency as they make investments in that country less attractive. Investors may seek better returns elsewhere, leading to a decrease in demand for the currency.

Traders closely monitor interest rate changes, as these can lead to significant fluctuations in currency prices. A decision by a central bank to raise or lower interest rates can trigger a sharp move in the Forex market.

2. Inflation and Economic Growth

Inflation refers to the rate at which prices for goods and services rise, reducing the purchasing power of money. Economic growth, on the other hand, is a measure of the overall expansion of an economy.

How Inflation and Economic Growth Impact Currency Values:

  • Low inflation typically indicates a stable economy, which can lead to stronger currencies. Central banks prefer to keep inflation in check, and low inflation rates often reflect healthy economic conditions.

  • High inflation, on the other hand, erodes the value of a currency because it decreases its purchasing power. Countries with high inflation rates often experience a decline in their currency value.

  • Economic growth tends to increase the demand for a currency. A country that shows strong GDP growth is often seen as a more attractive place to invest, leading to an increase in demand for its currency.

Forex traders watch economic indicators like the Consumer Price Index (CPI) and Gross Domestic Product (GDP) data to gauge inflation and growth trends and predict potential currency movements.

3. Employment Data and Unemployment Rates

Employment statistics, particularly the non-farm payroll (NFP) report in the United States, are crucial indicators for Forex traders. These reports provide insights into the health of the labor market and give clues about future economic activity.

How Employment Data Affects the Forex Market:

  • Strong employment data typically indicates a robust economy, which can lead to stronger currency values. More jobs generally lead to higher consumer spending, boosting economic growth.

  • High unemployment rates signal economic trouble and can lead to a weakening of the currency as it suggests sluggish growth and lower consumer confidence.

Unemployment data can cause significant price movements in the Forex market, especially when released from major economies like the U.S. or the Eurozone.

4. Trade Balance and Current Account Deficits

The trade balance is the difference between a country’s exports and imports. A country with a trade surplus exports more than it imports, which generally strengthens its currency. A trade deficit, where a country imports more than it exports, can lead to a weaker currency.

How Trade Balances Affect the Forex Market:

  • Trade surplus: Countries with a surplus often see increased demand for their currency as foreign buyers need to purchase the domestic currency to pay for exports.

  • Trade deficit: Countries with a deficit need to borrow more foreign capital to finance the deficit, which can weaken the currency.

Forex traders keep a close eye on trade balance reports and current account figures to assess a country’s external economic health and its impact on the currency market.

5. Geopolitical Events and Risk Sentiment

Geopolitical events such as political instability, elections, wars, and natural disasters can have significant impacts on currency prices. These events often create uncertainty and affect the market’s risk sentiment.

How Geopolitical Events Affect the Forex Market:

  • Political stability typically strengthens a country’s currency as investors seek safer environments for their capital.

  • Geopolitical risks such as conflicts, elections, or government instability can lead to a weakening of the currency, as investors may move their money to safer assets like the U.S. dollar or gold.

Traders must remain informed about global events that may influence the market’s risk appetite. Risk-off sentiment often leads to a flight to safer currencies, while risk-on sentiment tends to favor riskier assets and currencies.

6. Commodity Prices and Currencies

Many countries’ economies are closely tied to the prices of commodities such as oil, gold, and agricultural products. Commodity-exporting nations like Canada, Australia, and Russia are heavily affected by changes in the prices of these goods.

How Commodity Prices Affect Currencies:

  • Rising commodity prices can strengthen the currencies of commodity-exporting countries, as higher commodity prices increase their export revenues.

  • Falling commodity prices can weaken the currencies of commodity-exporting nations, as their revenues from exports decrease.

For example, if the price of oil rises, the Canadian dollar (CAD) often strengthens, as Canada is a major oil exporter.