Author Archives: admin

Artificial Intelligence in Forex Trading: The Future of Smart Strategies

Revolutionizing Forex Trading with Artificial Intelligence

In recent years, artificial intelligence (AI) has rapidly transformed many industries, and the world of forex trading is no exception. As traders seek smarter, faster, and more accurate ways to analyze the markets, AI has emerged as a game-changing tool.

What Is Artificial Intelligence in Forex?

Artificial Intelligence refers to systems or machines that mimic human intelligence to perform tasks and improve over time through data and algorithms. In forex trading, AI is used to analyze huge datasets, detect patterns, and make real-time decisions without human bias or fatigue.

Benefits of AI in Forex Trading

  • Speed and Accuracy: AI systems can process thousands of market signals per second, providing precise entry and exit points.
  • Emotion-Free Decisions: Unlike human traders, AI makes objective decisions, minimizing emotional trading errors.
  • Backtesting and Optimization: AI can simulate years of market data in minutes, helping refine strategies efficiently.
  • 24/7 Trading: AI bots never sleep. They monitor and act on market conditions around the clock.

Popular AI Tools for Forex Traders

Several platforms and services now offer AI-powered tools for retail and institutional traders. These include:

  • MetaTrader Expert Advisors (EAs) with AI integration
  • Trading bots based on neural networks
  • Signal services that use machine learning for predictions

Challenges and Considerations

While AI offers remarkable advantages, it also comes with challenges. These include:

  • The need for large amounts of quality data
  • Complexity in development and customization
  • Potential overfitting in predictive models

Is AI the Future of Forex Trading?

As the forex market becomes increasingly competitive, adopting AI tools is no longer optional—it’s essential. Whether you’re a beginner or a seasoned trader, incorporating AI into your strategy can give you a significant edge.

Exploring the Role of Technical Analysis in Forex Trading

The Importance of Technical Analysis in Forex Trading

In the world of Forex trading, technical analysis is one of the most widely used methods for making informed decisions. By analyzing past market data, such as price movements and trading volumes, traders attempt to predict future price movements. In this article, we will explore the role of technical analysis in Forex trading, its key tools, and how traders can use it to improve their trading strategies.

What is Technical Analysis?

Technical analysis is the study of historical price movements and trading volume to forecast future price movements. Unlike fundamental analysis, which focuses on economic factors and news events, technical analysis is based purely on market data. Traders use charts, patterns, and indicators to identify trends and potential entry and exit points in the market.

Key Tools of Technical Analysis

There are several key tools and concepts used in technical analysis to analyze price movements and make trading decisions. Some of the most popular ones include:

1. Price Charts

Price charts are the foundation of technical analysis. They visually display the historical price movement of a currency pair over a specified time period. There are different types of charts, including:

  • Line charts: These show the closing price of a currency pair over a period of time, connected by a line.
  • Bar charts: These display the open, high, low, and close prices for a currency pair over a set time period.
  • Candlestick charts: These are similar to bar charts but use candlestick-shaped bars to represent price movements, providing more visual information.

2. Trend Lines and Channels

Trend lines are used to identify the direction of the market. A trend line is drawn by connecting the highs or lows of the price action. There are three main types of trends:

  • Uptrend: When the market is making higher highs and higher lows.
  • Downtrend: When the market is making lower highs and lower lows.
  • Sideways trend (range-bound): When the market moves within a horizontal range.

Trend channels are formed by drawing parallel lines above and below the trend line. These channels help traders identify potential levels of support and resistance, providing a clearer view of where the price may reverse or break out.

3. Moving Averages

Moving averages are one of the most commonly used indicators in technical analysis. A moving average smooths out price data to create a trend-following indicator. There are two primary types:

  • Simple Moving Average (SMA): The average of a currency pair’s closing prices over a specified period.
  • Exponential Moving Average (EMA): Similar to the SMA but gives more weight to recent prices, making it more responsive to price changes.

Moving averages are often used to identify the overall trend direction and potential buy or sell signals when the price crosses above or below the moving average.

4. Support and Resistance Levels

Support and resistance levels are horizontal lines drawn on a chart to represent areas where price has historically reversed. Support is the price level at which a currency pair tends to stop falling and starts rising, while resistance is the price level where the pair tends to stop rising and begins to fall.

Traders use support and resistance levels to identify potential entry and exit points, as well as to set stop-loss and take-profit orders. A breakout above resistance or below support can signal a strong trend in the market.

5. Oscillators and Indicators

Oscillators are indicators that fluctuate between a defined range, helping traders identify overbought or oversold conditions in the market. Some common oscillators include:

  • Relative Strength Index (RSI): Measures the magnitude of recent price changes to determine whether a currency pair is overbought or oversold.
  • Stochastic Oscillator: Compares a currency pair’s closing price to its price range over a specific time period to generate buy or sell signals.
  • Moving Average Convergence Divergence (MACD): Shows the relationship between two moving averages and helps identify trend reversals.

These oscillators are used to confirm trends and identify potential turning points in the market.

How to Use Technical Analysis in Forex Trading

Traders use technical analysis to identify potential entry and exit points based on price patterns and indicators. Here’s how you can use technical analysis in your trading strategy:

1. Identify Market Trends

The first step in technical analysis is to identify the current market trend. Is the market in an uptrend, downtrend, or sideways trend? By analyzing price charts and using trend lines, traders can determine the direction of the market, which helps in making trading decisions.

2. Use Support and Resistance Levels

Support and resistance levels are key areas that can provide profitable entry and exit points. When the price approaches a support level, it may be a good time to buy, while resistance levels may signal an opportunity to sell. Breakouts from these levels often indicate the beginning of a new trend.

3. Use Indicators to Confirm Signals

Technical indicators such as moving averages, RSI, and MACD can help confirm potential buy or sell signals. For example, if the price is in an uptrend and the RSI shows that the market is not overbought, it could be a good time to enter a long position. Similarly, if the price is nearing a resistance level and the MACD is showing a bearish divergence, it may be a signal to sell.

4. Risk Management

Risk management is crucial in any trading strategy, including technical analysis. Traders should use stop-loss orders to limit potential losses and ensure they don’t risk more than a predetermined percentage of their capital on each trade. It’s also important to maintain a favorable risk-to-reward ratio to maximize profits and minimize losses over time.

Conclusion

Technical analysis is an essential tool for Forex traders who want to make informed and strategic trading decisions. By analyzing price charts, using key indicators, and understanding market trends, traders can improve their chances of success in the highly competitive Forex market. While technical analysis doesn’t guarantee profits, it provides traders with a structured approach to making trading decisions based on objective data.

The Role of Technical Analysis in Forex Trading

The Importance of Technical Analysis in Forex Trading

Forex trading is a highly dynamic and fast-paced market. To succeed, traders rely on various tools and strategies, and one of the most widely used methods is technical analysis. This approach focuses on analyzing historical price movements and using charts and indicators to predict future price trends. In this article, we will explore the importance of technical analysis in Forex trading and how traders can use it to make informed decisions.

What is Technical Analysis?

Technical analysis is a method of evaluating financial markets based on historical price data. It involves studying past price movements, volume, and other market data to forecast future price movements. Unlike fundamental analysis, which focuses on economic factors and news, technical analysis relies purely on charts and technical indicators to identify trends, patterns, and potential entry and exit points.

The Basics of Technical Analysis

Technical analysis is built on the belief that market prices move in trends and that historical price movements can predict future price action. Traders who use technical analysis believe that all information, including news and economic events, is reflected in the price action. As a result, they focus on price charts to analyze patterns and trends, which can be used to forecast where the price is likely to go next.

Some of the most common tools and concepts used in technical analysis include:

  • Price Charts: The foundation of technical analysis, showing the movement of prices over time.
  • Support and Resistance Levels: Price levels where the price tends to reverse direction, either bouncing upward (support) or downward (resistance).
  • Trend Lines: Lines drawn to identify the direction of the market (uptrend, downtrend, or sideways).
  • Indicators: Tools like moving averages, Relative Strength Index (RSI), and MACD that help traders identify trends and market conditions.
  • Chart Patterns: Visual formations such as head and shoulders, double tops, and triangles that can signal potential price movements.

Key Technical Indicators Used in Forex Trading

1. Moving Averages (MA)

Moving averages are one of the most popular and widely used indicators in Forex trading. They smooth out price data to create a trend-following indicator that helps traders identify the direction of the market. There are two main types of moving averages: the Simple Moving Average (SMA) and the Exponential Moving Average (EMA).

Traders use moving averages to identify potential buy or sell signals when the price crosses the moving average or when different moving averages cross each other. A crossover of the short-term moving average above the long-term moving average, for example, is seen as a bullish signal.

2. Relative Strength Index (RSI)

The Relative Strength Index (RSI) is a momentum oscillator that measures the speed and change of price movements. It ranges from 0 to 100 and is used to identify overbought or oversold conditions in the market. When the RSI is above 70, the market is considered overbought, signaling a potential reversal or a decrease in price. When the RSI is below 30, the market is considered oversold, signaling a potential upward reversal.

3. Moving Average Convergence Divergence (MACD)

The MACD is a trend-following momentum indicator that shows the relationship between two moving averages of a currency pair’s price. Traders look for MACD crossovers, divergence between the MACD and price, and MACD histogram patterns to identify potential buy and sell signals.

4. Bollinger Bands

Bollinger Bands are a volatility indicator that consists of three lines: a moving average in the middle, an upper band, and a lower band. The upper and lower bands are set a certain number of standard deviations above and below the moving average. When the price moves toward the outer bands, it signals an overbought or oversold market, which may indicate a reversal.

5. Fibonacci Retracement

Fibonacci retracement is a tool used to identify potential reversal levels based on the Fibonacci sequence. Traders use Fibonacci levels to identify key support and resistance areas, where the price may reverse or consolidate. These levels are drawn from significant price highs and lows, helping traders determine possible entry and exit points.

Benefits of Using Technical Analysis in Forex Trading

There are several advantages to using technical analysis in Forex trading:

  • Helps Identify Trends: Technical analysis allows traders to easily spot trends, making it easier to determine when to enter or exit a trade.
  • Provides Objective Signals: Unlike emotional trading decisions, technical analysis provides clear and objective signals based on market data and chart patterns.
  • Suitable for Any Market Condition: Technical analysis can be applied to any market, whether it’s trending, ranging, or volatile.
  • Effective for Short-Term Trading: Technical analysis is particularly useful for day traders and scalpers who need to make quick decisions in fast-moving markets.

Limitations of Technical Analysis

While technical analysis is a valuable tool, it is not without its limitations:

  • Not Always Accurate: Technical analysis is based on past price data, and past performance does not guarantee future results. Market conditions can change unexpectedly, making predictions unreliable at times.
  • Can Be Misleading: Overreliance on technical indicators can lead to false signals and misleading information. It’s important to combine technical analysis with other forms of analysis for more accurate predictions.
  • Requires Experience: Interpreting charts and indicators effectively takes practice and experience. New traders may struggle to use technical analysis properly without proper education and training.

Conclusion

Technical analysis is a powerful tool for Forex traders, helping them identify trends, support and resistance levels, and potential buy or sell signals. By understanding key technical indicators like moving averages, RSI, and MACD, traders can make informed decisions and increase their chances of success in the Forex market. However, it’s important to remember that no method is foolproof, and combining technical analysis with other strategies and risk management practices can lead to better trading outcomes.

The Impact of Economic Indicators on Forex Trading

How Economic Indicators Affect Forex Trading

Understanding economic indicators is crucial for successful Forex trading. These indicators provide valuable insights into the health of a country’s economy, helping traders to anticipate market trends and make informed trading decisions. In this article, we’ll explore how economic indicators influence currency values and how traders can use them to their advantage in Forex trading.

What Are Economic Indicators?

Economic indicators are statistical data points that reflect the economic performance of a country or region. These indicators are released by government agencies or private organizations and provide information on various aspects of the economy, such as growth, inflation, employment, and trade balance. There are three main types of economic indicators:

  • Leading Indicators: These provide predictions about future economic activity. They are useful for forecasting trends and potential market movements. Examples include consumer confidence indices and stock market performance.
  • Lagging Indicators: These reflect past economic activity. While they are not as useful for predicting future movements, they help traders understand the direction the economy is heading. Examples include GDP growth rate and unemployment data.
  • Coincident Indicators: These reflect current economic activity. They provide an up-to-date snapshot of the economy. Examples include industrial production and retail sales.

By understanding these indicators, traders can anticipate how currency pairs may move in response to economic data releases and adjust their strategies accordingly.

Key Economic Indicators that Impact Forex Trading

1. Gross Domestic Product (GDP)

GDP is one of the most important economic indicators. It measures the total value of all goods and services produced within a country over a specified period. A higher GDP generally indicates a growing economy, which can lead to stronger demand for the country’s currency. Conversely, a declining GDP suggests economic contraction, which can weaken the currency.

Traders often look for GDP growth that outperforms market expectations, as this can lead to a surge in currency value. GDP reports are typically released quarterly, and traders pay close attention to them for signs of economic health.

2. Inflation Rate

Inflation is a key indicator of an economy’s purchasing power and stability. A moderate level of inflation is considered healthy, but if inflation rises too quickly, it can erode the value of a currency. Central banks use monetary policy to manage inflation, often by adjusting interest rates.

If inflation is rising rapidly, the central bank may raise interest rates to control inflation. Higher interest rates can attract foreign investment, increasing demand for the currency and pushing its value higher. On the other hand, falling inflation can signal an economic slowdown and lead to a weaker currency.

3. Employment Data

Employment data is another critical economic indicator. The most widely followed employment report is the U.S. Non-Farm Payroll (NFP) report, which shows the number of jobs added or lost in the economy, excluding agricultural jobs. A strong employment report typically signals a healthy economy, which can increase demand for a currency.

Conversely, weak employment figures can indicate an economic downturn, leading to a drop in currency value. Traders often use employment data to gauge the strength of a country’s labor market and its potential impact on the currency.

4. Interest Rates

Interest rates set by central banks play a significant role in determining the value of a currency. When central banks raise interest rates, it increases the return on investments denominated in that currency, attracting foreign capital and causing the currency to appreciate.

On the other hand, when interest rates are lowered, it can result in a decrease in demand for the currency, causing it to depreciate. Forex traders closely monitor central bank announcements for any changes in interest rates, as they often lead to significant market movements.

5. Consumer Confidence Index (CCI)

The Consumer Confidence Index (CCI) measures consumer optimism about the economy. When consumers are confident in their financial situation and the overall economy, they are more likely to spend money, which stimulates economic growth.

A high CCI generally signals a strong economy, which can lead to a stronger currency. Conversely, a low CCI can indicate economic uncertainty, leading to a weaker currency. Traders use this data to gauge future consumer behavior and its potential impact on the economy.

How to Use Economic Indicators in Forex Trading

1. Stay Informed

The first step to using economic indicators effectively is staying informed. Economic data is released regularly, and traders need to keep track of upcoming reports and their expected impact on the market. There are many resources, such as economic calendars, that help traders anticipate when reports are due to be released.

2. Analyze Market Reactions

While economic indicators provide valuable information, it’s equally important to analyze how the market reacts to them. Sometimes, a report may come in better than expected, but the currency may not respond in the anticipated way. This can happen when traders have already priced in the expected results.

Therefore, traders should not only focus on the data itself but also on how the market responds to the data release. This requires understanding market sentiment and the broader economic context.

3. Develop a Trading Strategy Around Economic Indicators

Once you understand how economic indicators affect the Forex market, it’s important to incorporate them into your trading strategy. For example, you might choose to trade around key economic events, such as GDP reports or interest rate decisions, by analyzing historical reactions and setting up trades accordingly.

Alternatively, you could focus on currency pairs that are highly sensitive to specific indicators. For instance, EUR/USD is often influenced by U.S. employment data, while the British pound can be sensitive to inflation reports from the Bank of England.

Conclusion

Incorporating economic indicators into your Forex trading strategy can provide a significant edge in the market. Understanding how these indicators impact currency movements helps traders make informed decisions and predict market trends. By staying informed, analyzing market reactions, and adapting your strategy to economic data, you can improve your chances of success in the dynamic world of Forex trading.

Understanding Forex Trading Hours and Market Liquidity

How Forex Trading Hours Affect Market Liquidity

In Forex trading, the market operates 24 hours a day, 5 days a week, but this doesn’t mean that liquidity is constant throughout the day. Market liquidity, which refers to the ability to buy or sell assets without causing significant price movements, is one of the most important factors that traders should understand when participating in the Forex market.

The 24-Hour Forex Market

Unlike traditional stock markets, which are open during specific hours based on the country in which they are located, the Forex market operates continuously throughout the week. It opens on Sunday evening and closes on Friday evening (Eastern Standard Time), with various trading sessions that overlap and influence the market’s behavior.

The Forex market operates in four main trading sessions:

  • Asian Session (Tokyo): The Asian session starts the trading day. It’s known for its relatively lower volatility compared to the European and American sessions.
  • European Session (London): The London session is the most active trading period due to the high volume of traders and the overlap with the U.S. session.
  • U.S. Session (New York): This session sees a high amount of liquidity, especially when it overlaps with the European session, creating significant market movement.
  • Pacific Session (Sydney): The Sydney session is the least volatile, often leading to the lowest trading volume during the early part of the week.

The overlap between the European and U.S. sessions (from 8:00 AM to 12:00 PM EST) is often considered the best time to trade due to the increased market liquidity and volatility.

What Affects Forex Market Liquidity?

Market liquidity in Forex is largely affected by two factors: the volume of trades being executed and the volatility of the market. These factors fluctuate throughout the trading day based on various events, news releases, and the time of day.

1. Trading Volume

The more participants there are in the market, the higher the liquidity. The most liquid currency pairs are those that are frequently traded by institutional investors, hedge funds, banks, and other market participants. These pairs, such as EUR/USD, GBP/USD, and USD/JPY, tend to have tighter spreads and more consistent prices because there are so many buyers and sellers.

2. Economic News and Events

Major economic events, such as central bank interest rate decisions, employment reports, GDP figures, and geopolitical events, can cause sudden changes in market liquidity. For example, an interest rate hike by the U.S. Federal Reserve can trigger a significant shift in the USD’s value, leading to higher volatility and reduced liquidity as traders react to the news.

Traders need to stay informed about economic calendars and news releases that may impact market liquidity. Trading during important events can increase the potential for profit but also increases the risk of large price movements and slippage.

3. Time of Day

Market liquidity is generally higher when multiple major trading centers are open simultaneously. The best times to trade Forex are during the overlap of major market sessions, specifically when the London and New York sessions coincide. This period offers increased liquidity and volatility, making it a prime time for day traders and scalpers to execute their strategies.

How to Take Advantage of Market Liquidity

To maximize your potential for profit in the Forex market, it’s essential to understand the relationship between trading hours and market liquidity. Here are a few tips to help you navigate the market more effectively:

1. Trade During High Liquidity Hours

As mentioned earlier, liquidity is highest during the overlap between the European and U.S. trading sessions. During this period, market volatility tends to be higher, and traders can take advantage of bigger price movements. If you are a day trader or scalper, this is the ideal time to execute quick trades.

2. Avoid Trading During Low Liquidity Hours

The early hours of the U.S. session, as well as the Sydney and Tokyo sessions, tend to have lower liquidity. During these times, the market may experience sluggish price movements, wide spreads, and fewer trade opportunities. While it’s not impossible to trade during these hours, it’s generally better to avoid them unless you have a specific strategy for these low liquidity times.

3. Use Limit Orders

When trading in periods of high volatility, it’s a good idea to use limit orders rather than market orders. A limit order allows you to set a specific price at which you want to buy or sell an asset. This ensures that you don’t get filled at an unfavorable price during periods of high volatility when liquidity is lower, and prices can move rapidly.

4. Watch for Slippage

Slippage occurs when there is a difference between the expected price of a trade and the actual price at which the trade is executed. It happens when there is low liquidity, and prices move quickly due to news events or volatile market conditions. During periods of high liquidity, slippage is less likely, so it’s beneficial to trade during active sessions.

Forex Liquidity and Risk Management

Market liquidity has a direct impact on risk management. The more liquid the market, the easier it is to execute trades without significant slippage. On the other hand, low liquidity can make it harder to enter or exit positions, especially when large price movements occur. Understanding the dynamics of Forex liquidity will help you develop more effective risk management strategies, such as adjusting stop-loss levels or using proper position sizing to protect your capital during times of low liquidity.

How to Develop a Profitable Forex Trading Strategy

Building a Profitable Forex Trading Strategy

In the world of Forex trading, having a solid trading strategy is crucial for long-term success. While some traders rely on pure luck or guesswork, the most successful traders base their decisions on a well-thought-out strategy. In this article, we will dive deep into the process of developing a profitable Forex trading strategy, covering the essential components and tools needed to create one that suits your trading style and risk tolerance.

The Importance of a Forex Trading Strategy

Without a clear strategy, Forex trading can quickly become a gamble. A trading strategy is your roadmap for navigating the market, helping you decide when to enter and exit trades, how much to risk on each trade, and what tools to use to analyze the market. With the right strategy in place, you can minimize risks, control your emotions, and improve your chances of making consistent profits.

In addition to that, a trading strategy helps you avoid emotional decision-making. Fear, greed, and impatience are common emotions in trading, and they can lead to poor decision-making. A well-defined strategy helps you stick to your plan, ensuring that you trade systematically rather than react impulsively to market movements.

Key Components of a Profitable Forex Trading Strategy

1. Clear Trading Goals

Before you develop a strategy, it’s important to set clear trading goals. These goals should be specific, measurable, achievable, realistic, and time-bound (SMART goals). For example, you might set a goal to achieve a 5% return on your account each month or reduce your drawdown to a maximum of 10%. Setting clear goals helps you stay focused and gives you something to measure your progress against.

Having well-defined goals also enables you to track your performance over time, allowing you to make adjustments as needed. Without goals, it’s easy to lose direction and trade aimlessly, which can quickly lead to losses.

2. Risk Management

Risk management is a critical aspect of any profitable Forex trading strategy. It involves determining how much of your capital you are willing to risk on each trade and how to protect your investments from significant losses. Proper risk management ensures that a few losing trades won’t wipe out your entire account balance.

One of the key principles of risk management is the 1-2% rule, which suggests that you should never risk more than 1-2% of your total trading capital on a single trade. This minimizes the impact of any single loss and ensures that you can continue trading even after a series of losing trades.

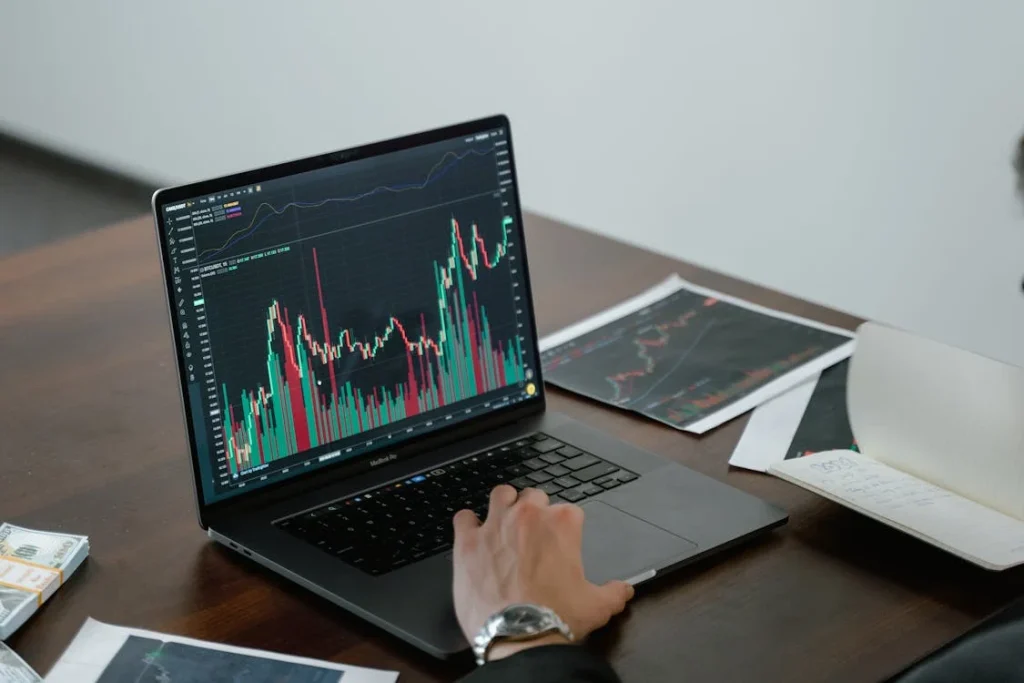
3. Technical Analysis

Technical analysis is the study of past market data, primarily price and volume, to predict future price movements. It is one of the most widely used tools in Forex trading. A trader who uses technical analysis examines charts, trends, and indicators to identify potential trade opportunities.

There are many technical indicators available, including Moving Averages, Relative Strength Index (RSI), Bollinger Bands, and MACD, each offering valuable insights into the market’s current state. By learning how to use these indicators effectively, you can enhance your ability to predict price movements and make informed decisions.

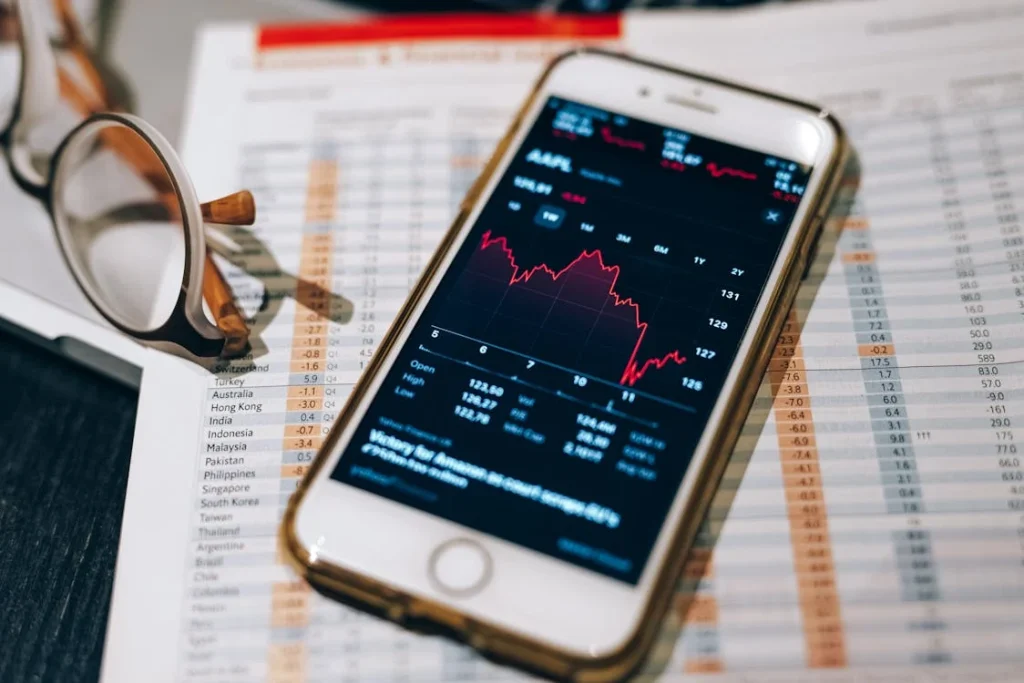
4. Fundamental Analysis

In addition to technical analysis, many successful Forex traders also incorporate fundamental analysis into their strategies. Fundamental analysis involves studying economic indicators, such as interest rates, inflation data, employment figures, and geopolitical events, to assess the underlying factors that influence currency prices.

While technical analysis focuses on price action and chart patterns, fundamental analysis looks at the broader economic picture. By combining both types of analysis, traders can develop a more comprehensive understanding of the market and make more informed trading decisions.

5. Trading Plan

Having a well-documented trading plan is essential for success in Forex trading. A trading plan outlines your trading strategy, including entry and exit rules, risk management techniques, trading goals, and any other important guidelines for your trading activity.

Your trading plan should be clear and easy to follow, and it should reflect your personal trading style and risk tolerance. Whether you are a scalper, day trader, or swing trader, your plan should include specific rules for each aspect of your trading, including which currency pairs to trade, when to enter and exit trades, and how much risk to take on each position.

6. Backtesting and Optimization

Once you have developed a Forex trading strategy, it’s crucial to test it before using real money. Backtesting involves applying your strategy to historical price data to see how it would have performed in the past. This process helps you assess the viability of your strategy and make adjustments if necessary.

Many trading platforms, such as MetaTrader 4 and MetaTrader 5, offer backtesting tools that allow you to test your strategy over different timeframes and market conditions. If your strategy performs well in backtesting, it’s more likely to succeed in live market conditions, but there’s no guarantee of future results.

7. Adaptability and Flexibility

Even the most successful traders understand that the Forex market is constantly changing. A strategy that works well in one market environment may not work as effectively in another. Therefore, it’s important to remain adaptable and flexible in your approach to trading.

Markets go through different phases, including trending, consolidating, and volatile periods. As a trader, you need to be able to adjust your strategy based on the current market conditions. Being too rigid in your approach can lead to missed opportunities or unnecessary losses.

8. Keep a Trading Journal

Keeping a detailed trading journal is one of the best ways to improve your trading skills and develop a profitable strategy over time. In your journal, record all of your trades, including the entry and exit points, position size, reason for the trade, and the outcome. This allows you to review your performance, identify patterns, and learn from your successes and mistakes.

A trading journal also helps you track your emotional state during trades, as emotions can greatly affect trading decisions. By keeping a journal, you can learn to manage your emotions and develop a more disciplined approach to trading.

Mastering Risk Management in Forex Trading

How to Effectively Manage Risk in Forex Trading

Risk management is one of the most important aspects of successful Forex trading. Many traders focus heavily on technical and fundamental analysis, but without proper risk management, all the skills in the world can’t save you from significant losses. In this article, we’ll discuss why risk management is essential, how to implement effective risk strategies, and the tools available to help protect your investments in the Forex market.

Why Risk Management is Crucial in Forex Trading

The Forex market is highly volatile and unpredictable, which means that traders can experience significant price swings in a short amount of time. While this volatility can create opportunities for profit, it also increases the potential for losses. Without a solid risk management plan, a trader could wipe out their trading account in a single bad trade.

Effective risk management allows traders to protect their capital and limit losses, ensuring they can stay in the game even during tough market conditions. It’s not about eliminating risk—because that’s impossible—but rather about managing and mitigating that risk in a way that maximizes your chances for long-term success.

Key Risk Management Strategies in Forex Trading

1. Set Stop-Loss Orders

One of the most basic yet crucial risk management tools in Forex trading is the stop-loss order. A stop-loss is an order placed with your broker to automatically close a trade at a predetermined price level if the market moves against you. Setting a stop-loss limits the amount of loss you can incur on any given trade, providing you with peace of mind and preventing emotional decision-making.

It’s essential to set your stop-loss levels based on technical analysis and not on your emotions. Many traders make the mistake of moving their stop-loss order further away from the market price in hopes that the trade will reverse in their favor. This increases the risk of larger losses and defeats the purpose of risk management.

2. Use Position Sizing

Position sizing refers to determining how much of your capital you should risk on each individual trade. The size of your position should be based on the level of risk you’re willing to take, not on the potential profit. A common rule of thumb is to risk no more than 1-2% of your total trading capital on any single trade. This means that if you have a $10,000 trading account, you should risk no more than $100-$200 per trade.

By using proper position sizing, you limit your exposure to risk and ensure that even if you experience a string of losing trades, you’ll still have enough capital to keep trading. This is essential for long-term profitability in Forex.

3. Diversify Your Portfolio

Diversification is a risk management strategy that involves spreading your investments across different assets or currency pairs to reduce exposure to any single asset’s risk. In Forex, this could mean trading multiple currency pairs instead of focusing on just one. By diversifying, you reduce the risk that a single trade could negatively impact your overall portfolio.

However, it’s important to note that diversification should be done strategically. Trading too many pairs or assets without adequate knowledge can lead to confusion and mistakes. Focus on currency pairs that you understand and monitor their movements closely.

4. Implement a Risk-Reward Ratio

The risk-reward ratio is a critical concept in risk management. It represents the potential profit of a trade compared to the potential loss. A good risk-reward ratio is typically considered to be 1:2 or higher, meaning you’re risking $1 to potentially make $2 or more. By maintaining a favorable risk-reward ratio, you ensure that your potential gains outweigh the losses.

For example, if you’re willing to risk $50 on a trade, you should aim for a profit of $100 or more. This approach increases your chances of making consistent profits over time, even if you experience a few losing trades.

5. Don’t Overtrade

Overtrading occurs when traders take excessive positions or trade too frequently in an attempt to make up for past losses or generate quick profits. This can lead to emotional decision-making and increased risk. It’s essential to trade with a clear plan and avoid chasing after quick wins. Stick to your trading strategy, and only enter trades that meet your criteria for a good risk-reward ratio.

Tools for Risk Management in Forex

1. Risk Calculators

Many Forex brokers offer risk calculators that allow traders to assess the risk of each trade before entering. These calculators take into account factors like your position size, stop-loss levels, and account balance to estimate potential losses or gains. By using a risk calculator, you can make informed decisions about how much to risk on each trade.

2. Trailing Stop Orders

A trailing stop is a variation of a stop-loss order that adjusts automatically as the market moves in your favor. For example, if the market moves in the direction of your trade, your stop-loss order will follow the market at a set distance, allowing you to lock in profits while still giving the trade room to move further in your favor. This tool helps protect profits while also limiting losses if the market reverses.

3. Forex Risk Management Software

Forex risk management software is another tool that traders can use to track and manage their risks. These software programs can help you analyze your trading performance, identify areas where you’re overexposed to risk, and provide insights into how to improve your risk management strategy. Many traders use these tools to stay disciplined and ensure they’re sticking to their risk management rules.

Final Thoughts

Risk management is crucial for long-term success in Forex trading. By implementing proper strategies such as setting stop-loss orders, using position sizing, and maintaining a favorable risk-reward ratio, you can protect your capital and improve your chances of consistent profitability. Remember that no strategy is foolproof, but by managing risk effectively, you increase your chances of surviving and thriving in the competitive Forex market.

How to Utilize Technical Analysis in Forex Trading for Better Accuracy

Unlocking the Power of Technical Analysis in Forex Trading

Forex trading involves predicting price movements in the foreign exchange market to make profits. While there are various approaches to trading, technical analysis is one of the most commonly used methods among traders. This article will explore how technical analysis works, why it’s important, and how you can use it to improve your accuracy in Forex trading.

What is Technical Analysis in Forex Trading?

Technical analysis is the study of past price movements and trading volumes to forecast future price actions. It relies on the idea that historical price data contains all the information needed to make predictions about future price movements. Technical analysts use charts and indicators to identify patterns, trends, and market conditions that can help determine the best times to buy or sell currency pairs.

Unlike fundamental analysis, which focuses on economic and financial data to assess a currency’s value, technical analysis focuses solely on price and volume data. The primary goal is to identify price trends and reversals, which traders can capitalize on.

Key Components of Technical Analysis

1. Price Charts

Price charts are the foundation of technical analysis. They visually represent the historical price movements of a currency pair over a specific period of time. The most commonly used types of charts are:

  • Line Charts: These are simple charts that plot the closing prices of a currency pair over time.
  • Bar Charts: These charts display the opening, closing, high, and low prices for each period.
  • Candlestick Charts: Candlestick charts provide more detailed information about price movements and are the most popular among Forex traders.

Each type of chart provides valuable insights into price trends, volatility, and patterns, helping traders make informed decisions.

2. Technical Indicators

Technical indicators are mathematical calculations based on price and volume data that are used to identify trends, momentum, volatility, and market strength. Some of the most commonly used indicators in Forex trading include:

  • Moving Averages: These indicators smooth out price data to help identify trends. Simple moving averages (SMA) and exponential moving averages (EMA) are the most common types.
  • Relative Strength Index (RSI): The RSI measures the magnitude of recent price changes to evaluate overbought or oversold conditions in a currency pair.
  • Bollinger Bands: Bollinger Bands help assess price volatility by creating a band around a moving average. When price breaks through the bands, it may indicate a potential trend reversal.
  • MACD (Moving Average Convergence Divergence): The MACD is used to determine the direction and strength of a trend by comparing two different moving averages.

By analyzing these indicators, traders can gain insights into market conditions and make more accurate predictions about future price movements.

3. Chart Patterns

Chart patterns are formations created by the price movements of a currency pair. These patterns can indicate trend reversals or continuation. Some of the most popular chart patterns include:

  • Head and Shoulders: A reversal pattern that signals the end of an uptrend or downtrend.
  • Double Top and Double Bottom: Patterns that indicate a reversal in the current trend.
  • Triangles: These patterns typically indicate a consolidation phase, with the breakout direction suggesting future price movement.

Recognizing these chart patterns allows traders to predict when a trend may reverse or continue, providing opportunities for profitable trades.

Why Technical Analysis is Important for Forex Traders

Technical analysis is essential for several reasons:

  • It helps predict market trends: Technical analysis provides valuable insights into the market’s behavior, helping traders predict the direction of price movements.
  • It eliminates emotional decision-making: Relying on technical analysis can help traders make decisions based on data and facts rather than emotions like fear or greed.
  • It provides clear entry and exit points: By using indicators, chart patterns, and trendlines, traders can identify precise entry and exit points, improving the accuracy of their trades.
  • It works in any market condition: Whether the market is trending, consolidating, or reversing, technical analysis can be applied in any market condition to help traders navigate the market.

How to Apply Technical Analysis in Your Trading Strategy

1. Identify the Trend

The first step in technical analysis is identifying the current trend. This can be done using trendlines or moving averages. Once you identify the trend, you can trade in the direction of that trend, which increases your chances of success.

2. Use Indicators to Confirm the Trend

Once you’ve identified the trend, you can use indicators such as the RSI, MACD, or Bollinger Bands to confirm that the trend is strong and likely to continue. This helps eliminate false signals and improves the accuracy of your trades.

3. Look for Chart Patterns

Chart patterns can signal potential trend reversals or breakouts. For example, a head-and-shoulders pattern may signal the end of an uptrend, while a double bottom could indicate the beginning of a new bullish trend. Recognizing these patterns helps traders enter and exit the market at the right time.

4. Set Stop-Loss and Take-Profit Levels

Using technical analysis to identify key levels of support and resistance allows traders to set effective stop-loss and take-profit levels. These levels act as a safety net, helping protect your capital in case the market moves against your position.

Conclusion

Technical analysis is a powerful tool that helps Forex traders make more accurate predictions about currency price movements. By using price charts, technical indicators, and chart patterns, traders can identify trends, entry and exit points, and market conditions that improve their trading decisions. Although technical analysis is not foolproof, when combined with sound risk management practices, it can significantly enhance a trader’s chances of success in the Forex market.

Exploring the Importance of Fundamental Analysis in Forex Trading

How to Leverage Fundamental Analysis to Improve Your Forex Trading

In the world of Forex trading, traders often use two main types of analysis to guide their trading decisions: technical analysis and fundamental analysis. While technical analysis focuses on price movements and chart patterns, fundamental analysis looks at the economic, social, and political factors that influence currency prices. In this article, we will dive deep into the importance of fundamental analysis in Forex trading and how it can enhance your trading strategy.

What is Fundamental Analysis?

Fundamental analysis in Forex trading involves analyzing the underlying economic and financial factors that affect currency values. This type of analysis considers a range of factors, such as interest rates, inflation, unemployment rates, GDP growth, and geopolitical events. The goal is to assess the overall economic health of a country and predict how these factors might influence the strength or weakness of its currency.

Unlike technical analysis, which looks at historical price data and chart patterns, fundamental analysis focuses on the intrinsic value of a currency and the overall economic conditions of the country behind it. Traders who use fundamental analysis aim to identify currencies that are undervalued or overvalued, based on economic data and news events.

Key Factors Influencing Currency Prices

1. Interest Rates

Interest rates play a major role in determining currency values. Central banks set interest rates as part of their monetary policy to control inflation and stimulate or cool down the economy. When a central bank raises interest rates, it typically strengthens the national currency, as higher rates attract foreign investment. Conversely, when interest rates are lowered, the currency often weakens, as the returns on investments become less attractive.

2. Inflation Rates

Inflation is another critical factor in currency valuation. A country with high inflation typically experiences a depreciation of its currency because inflation erodes the purchasing power of the currency. Conversely, a country with low inflation tends to have a stronger currency, as its purchasing power remains stable. Forex traders closely monitor inflation data, such as the Consumer Price Index (CPI), to assess the impact on currency movements.

3. Economic Indicators

Economic indicators, such as GDP growth, employment reports, and industrial production, provide insights into the overall health of an economy. Strong economic performance often leads to a stronger currency, as it reflects the country’s growth potential and attractiveness to investors. On the other hand, weak economic indicators can lead to a weaker currency as investors may seek more stable economies.

4. Political Events and Geopolitical Risks

Political events and geopolitical risks can have a significant impact on currency prices. Elections, government policy changes, trade negotiations, and geopolitical tensions can all influence market sentiment and cause currency fluctuations. Traders must stay informed about these events and understand their potential impact on the Forex market.

How to Use Fundamental Analysis in Your Trading Strategy

1. Economic Calendar

One of the most valuable tools for traders using fundamental analysis is the economic calendar. The economic calendar lists key economic events, reports, and data releases that can move the markets. By keeping track of important events, such as interest rate decisions, GDP reports, and employment data, traders can anticipate market reactions and adjust their trading strategies accordingly.

2. Central Bank Policies

Central banks have a direct influence on currency prices through their monetary policies. Traders who follow central bank announcements, such as changes in interest rates or monetary tightening/easing, can gain insights into the direction of a currency’s value. For example, if a central bank signals that it plans to raise interest rates, traders may buy the currency in anticipation of its appreciation.

3. Economic Reports and News Releases

Forex traders closely monitor economic reports and news releases to gauge the strength of a country’s economy. Key reports include GDP growth, employment data, inflation figures, and trade balances. These reports provide a snapshot of the overall economic conditions and can lead to significant currency price movements.

4. Market Sentiment and News Analysis

Understanding market sentiment is essential for applying fundamental analysis in Forex trading. News events, such as geopolitical tensions, natural disasters, or economic crises, can cause drastic shifts in market sentiment. Traders need to be aware of how news and events can affect investor behavior and drive currency price fluctuations.

The Advantages of Fundamental Analysis in Forex Trading

There are several advantages to using fundamental analysis in Forex trading:

  • Long-term trends: Fundamental analysis is particularly useful for identifying long-term trends in the Forex market. By assessing the underlying economic conditions, traders can anticipate currency movements over weeks, months, or even years.
  • Informed decision-making: Fundamental analysis provides traders with a deeper understanding of the factors that influence currency prices. This allows traders to make more informed decisions based on the economic outlook of a country.
  • Less reliance on technical analysis: By focusing on the economic fundamentals, traders can reduce their reliance on technical analysis. This approach can be especially useful when technical signals are ambiguous or contradictory.

Challenges of Fundamental Analysis

While fundamental analysis is a powerful tool, it does come with some challenges:

  • Complexity: Fundamental analysis requires a deep understanding of economic indicators, central bank policies, and global events. This can be overwhelming for beginner traders who may find it difficult to keep up with all the information.
  • Timing: The impact of economic data or news events can take time to materialize in currency prices. Traders need to be patient and wait for the right opportunities to enter or exit the market.
  • Market reactions: While economic data and news events provide valuable insights, the market’s reaction to these factors can be unpredictable. In some cases, the market may react to news in ways that don’t align with the fundamentals.