Mastering Forex Market Trends with Technical Analysis
Technical analysis is one of the most essential tools for Forex traders looking to make informed decisions in the market. It involves the study of past market data, primarily price and volume, to forecast future market movements. This guide will explore the role of technical analysis in Forex trading, providing insights into key concepts, tools, and strategies that traders use to gain an edge in the market.
Understanding Technical Analysis
At its core, technical analysis is based on the idea that all information relevant to the market is already reflected in the price of an asset. This means that by analyzing price charts and historical data, traders can identify trends and patterns that may signal future price movements.
Unlike fundamental analysis, which focuses on economic factors, news, and geopolitical events, technical analysis is solely concerned with the price action and market sentiment. Traders use charts, indicators, and various tools to evaluate past market behavior and predict future trends.
Key Tools and Indicators in Technical Analysis
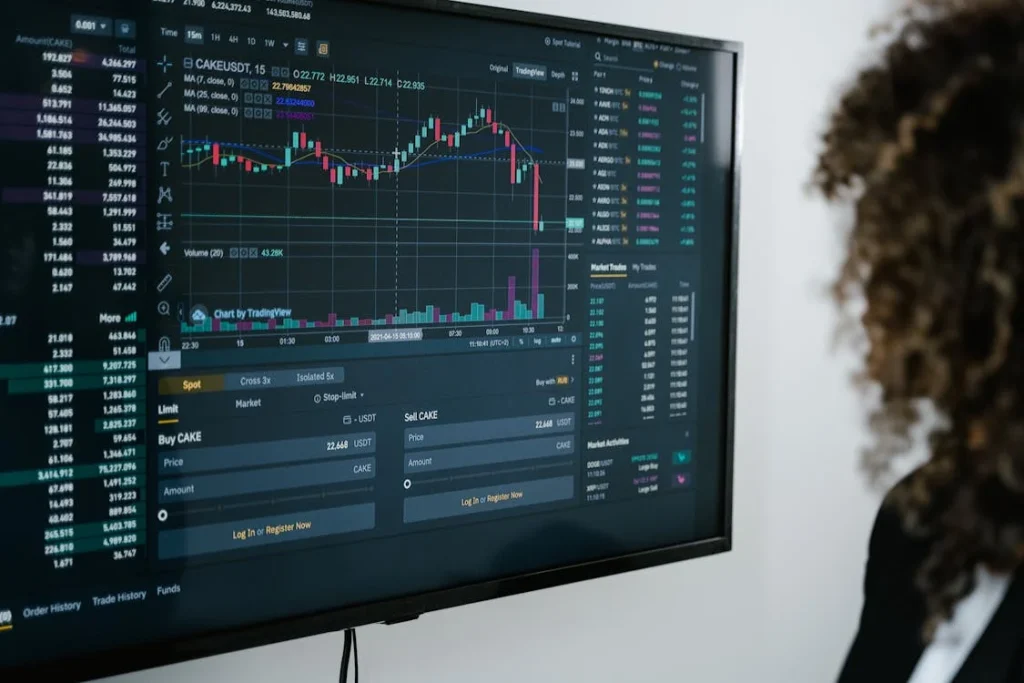
1. Price Charts
The most basic tool in technical analysis is the price chart. Price charts visually represent the price movement of an asset over a specific period. The most common types of price charts include line charts, bar charts, and candlestick charts. Candlestick charts are particularly popular among Forex traders due to the detailed information they provide about market sentiment.
2. Trend Lines and Channels
Trend lines are used to identify the direction of the market, whether it’s an uptrend, downtrend, or sideways trend. Traders draw trend lines by connecting the higher highs and higher lows in an uptrend or the lower highs and lower lows in a downtrend. Channels are parallel lines that are drawn above and below the trend line to define the range within which the price is moving.
3. Moving Averages
Moving averages are one of the most commonly used indicators in technical analysis. They smooth out price data to create a trend-following indicator that helps traders identify the direction of the market. The two most commonly used moving averages are the Simple Moving Average (SMA) and the Exponential Moving Average (EMA).
4. Relative Strength Index (RSI)
The Relative Strength Index (RSI) is a momentum oscillator that measures the speed and change of price movements. It is used to identify overbought or oversold conditions in the market. An RSI value above 70 typically signals that the market is overbought, while a value below 30 suggests that the market is oversold.
5. Bollinger Bands
Bollinger Bands consist of a simple moving average and two standard deviation lines that help traders assess market volatility. When the price moves toward the upper band, the market is considered overbought, while when it moves toward the lower band, the market is considered oversold.
Using Technical Analysis to Formulate Trading Strategies
1. Trend Following Strategy
The trend-following strategy is one of the most common methods used in technical analysis. Traders who use this strategy aim to enter trades in the direction of the prevailing trend. They look for signs of strong trends, such as breakouts, and then use indicators like moving averages or RSI to confirm the trend’s strength.
2. Breakout Trading
Breakout trading involves entering a position when the price breaks through a key level of support or resistance. Breakouts often lead to significant price movements, and traders use technical indicators such as volume and momentum oscillators to confirm the breakout’s strength.
3. Reversal Trading
Reversal trading focuses on identifying points where the market is likely to reverse direction. Traders look for patterns such as double tops, double bottoms, or head and shoulders, and use indicators like RSI or Stochastic Oscillators to confirm the reversal signal.
Advantages of Technical Analysis in Forex Trading
Technical analysis provides several advantages for Forex traders. One of the key benefits is that it can be applied to any time frame, making it suitable for day traders, swing traders, and long-term investors alike. Additionally, technical analysis is objective, as it relies on historical data and clear patterns, reducing the emotional aspect of decision-making.
Another advantage is that technical analysis allows traders to spot trends and potential price movements before they occur, giving them a potential edge in the market. By using a combination of technical indicators and chart patterns, traders can improve their chances of making profitable trades.
Limitations of Technical Analysis
While technical analysis is a powerful tool, it does have its limitations. It is not foolproof, and there is always a risk of false signals. Additionally, technical analysis relies solely on past price data, which may not always accurately predict future market conditions. Traders should combine technical analysis with sound risk management practices and, where appropriate, incorporate fundamental analysis into their trading strategy.